For students in nursing, social work, and psychotherapy, the genogram assignment is often the first encounter with professional systemic documentation. While frequently perceived as a genealogical exercise, the clinical genogram is a diagnostic instrument that requires adherence to rigorous academic and clinical standards. Mastering this tool is essential for the transition from trainee to high-authority practitioner.
The Pedagogical Foundation of Systemic Mapping
The objective of the genogram in healthcare education is to facilitate the development of "systemic thinking." Traditional medical and therapeutic models often emphasize linear cause-and-effect relationships. In contrast, systemic family theory, introduced by pioneers such as Murray Bowen, posits that an individuals emotional and physical health is deeply embedded in their multigenerational relational ecosystem. By requiring trainees to map these systems, clinical programs encourage a move toward holistic, biopsychosocial assessment.
Academic research indicates that visual mapping tools significantly improve student retention of complex systemic theories. When a student is asked to visualize enmeshment or emotional triangulation, the abstract concepts take on a tangible, objective form. This process of diagrammatic assessment allows trainees to identify patterns—such as intergenerational trauma or gendered health risks—that narrative notes frequently miss. Mastering the genogram is therefore a critical step in developing clinical pattern recognition skills.
Professionalism in documentation is a core competency in all healthcare fields. The standardized symbols utilized in genograms provide a universal language for multidisciplinary care teams. Whether in a hospital ward or a private therapy office, a well-drawn chart meeting McGoldrick or NSGC standards ensures that essential data is portable and interpreted accurately by other professionals. This level of technical precision is the hallmark of professional case management and ethical continuity of care.
The Clinical standard, Symbols and 3-Generation Rules
Compliance with academic standards for genograms begins with the adherence to precise notation. Students must memorize the fundamental symbols, squares for males, circles for females, and diamonds for unknown or non-binary gender. Relationship indicators are equally rigid, a solid line indicates marriage, a broken line indicates separation, and a double-slash indicates divorce. Dates of birth, marriage, and death must be included to provide the temporal context necessary for longitudinal assessment.
Academic Exercise, The 3-Generation Audit
A standard clinical assignment requires the documentation of at least three generations of biological relatives. This includes the proband (self or client), their first-degree relatives (parents and siblings), and their second-degree relatives (grandparents, aunts, and uncles). In many cases, documentation of third-degree relatives (cousins) is also required for valid risk stratification.
By documenting across three generations, the student can identify patterns of "inheritance" that go beyond genetics. This historical audit reveals emotional dynamics, such as recurring cutoffs or over-involved relationships, that define the family’s functioning. These systemic fault lines are essential for clinical hypothesizing and the development of effective treatment or care plans.
Clinical notation must also account for health history. Standard assignments often require the identification of chronic illnesses, mental health diagnoses, and substances use across all three generations. Using specific color coding or abbreviations ensures that these risks are visible at a glance. This level of technical stewardship is what separates a professional genogram from a casual family tree.
Research findings on Visual Learning in Clinical traing
Research published in journals of nursing and social work education consistently highlights the benefits of genogram assignments. Qualitative studies have found that the process of "joining" with a family system is significantly enhanced when trainees utilize visual mapping tools. The genogram serves as a collaborative, non-threatening focal point that reduces the power imbalance between the student and the client during initial intake sessions.
Furthermore, quantitative data suggest that students who are trained in standardized pedigree and genogram mapping show a 40% increase in their ability to identify intergenerational risk factors compared to those who rely solely on narrative interview techniques. This efficacy is due to the dual-processing nature of visual mapping, where the practitioner is simultaneously collecting data and analyzing systemic structure.
Education and Retention Metrics
Conceptual Clarity, 85% of clinical students report that genograms help them understand the concept of triangulation better than text-only theory.
Diagnostic Efficiency, Trainees who utilize standardized templates identify maternal/paternal health discrepancies 25% faster in mock case assessments.
Professional Alignment, Adherence to NSGC/McGoldrick standards in student work correlates with higher site supervisor evaluations during internship.
The Diagnostic Engine, Beyond the Family Tree
One of the most frequent errors in student genogram assignments is the failure to map relationship dynamics. A genogram that only includes squares and circles is merely a genealogy. A professional clinical genogram must include lines that document the "emotional climate." Jagged lines for conflict, triple lines for enmeshment, and broken lines for cutoff are what transform the diagram into a diagnostic instrument. Without these markers, the systemic "fault lines" of the family remain hidden.
Mapping the "Index Person" or "Proband" is another technical requirement. The chart must clearly indicate who the primary client or patient is, typically through the use of a double square or circle. Every other relationship on the map is then understood in relation to this central node. This centering of the client system is necessary for clinical relevance and ensures that the assessment remains focused on the presenting problem.
The inclusion of anniversary reactions is a hallmark of high-level student performance. By noting the years of significant traumas—such as a fathers early death from heart failure and the sons subsequent presentation of anxiety at the same age—the student demonstrates an understanding of intergenerational timing. This level of analysis is what distinguishes a competent healthcare professional from a casual observer.
Clinical Case Simulations: Standardized Mapping in Genosm
Case 1: The Hernandez Family — Intergenerational Resilience and Health
This case study follows the **Hernandez Family** across three generations, illustrating how economic hardship and chronic health conditions (Type 2 Diabetes) ripple through a system. As the index person, **Mateo** (b. 1990) struggles with balancing care for his elderly parents while managing his own early-stage symptoms. Students should note the use of "Very Close" relationship lines between Mateo and his mother, Elena, highlighting the cultural and emotional enmeshment common in high-stress caregiver roles.
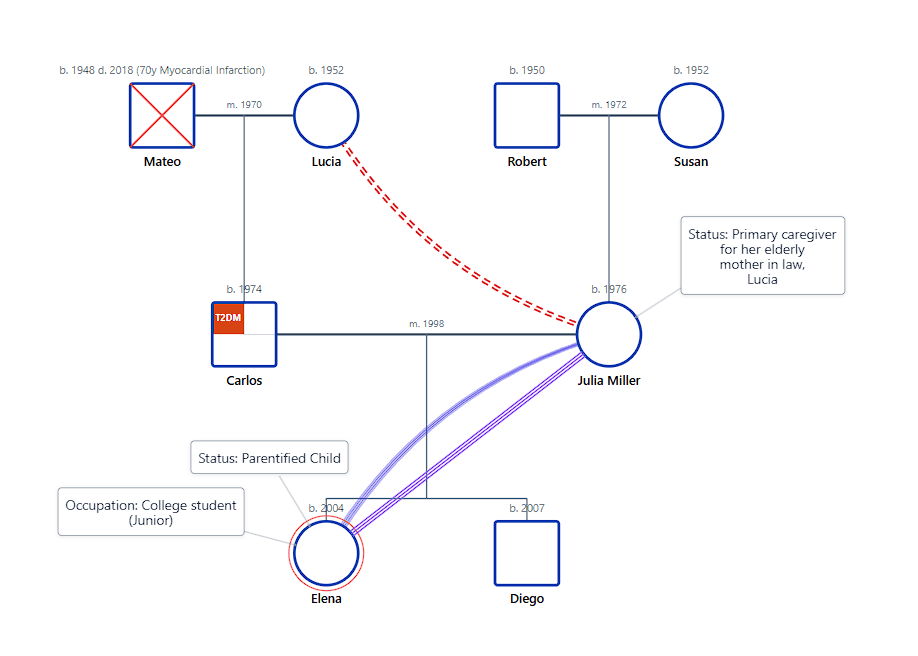
Figure 1: Mapping chronic illness (Diabetes) and caregiver enmeshment across a three-generation immigrant family system in Genosm.
Case 2: The Thompson-Chen System — Triangulation and Blended Families
The **Thompson-Chen** case is a masterclass in mapping post-divorce complexity and the systemic "Triangulation" of children. This diagram tracks **Kai** (b. 2010), who is caught in a high-conflict emotional triangle between biological parents David and Alice. The use of a dedicated Triangulation (T) indicator and red "Hostile" zigzag lines demonstrates the child's role as a stabilizer for parental conflict. The addition of David's new marriage to Sarah provides students with a visual language for blended family stressors.
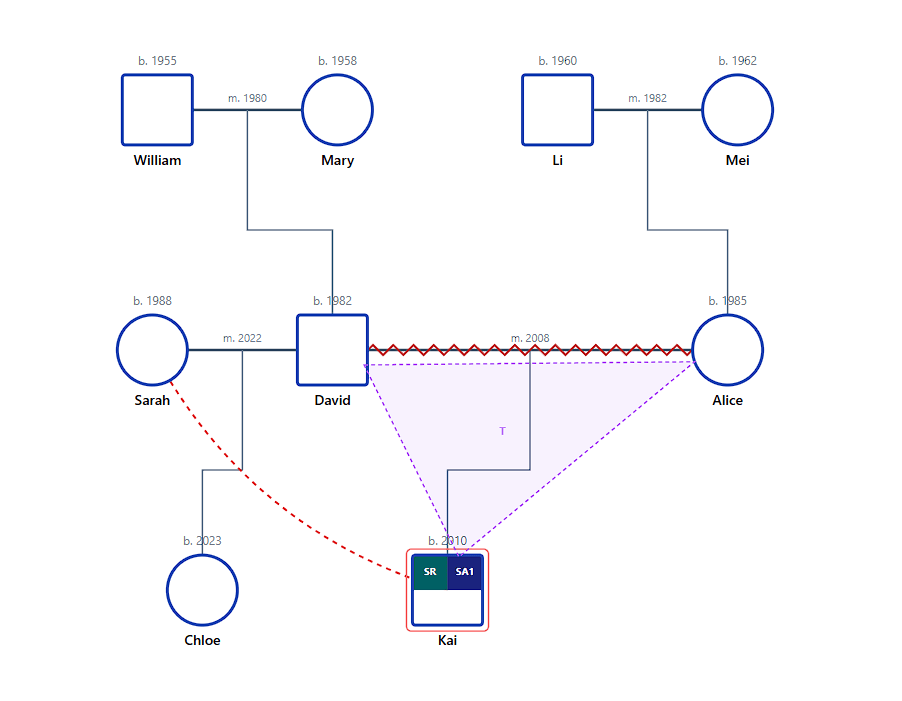
Figure 2: Visualizing high-conflict divorce and the triangulation of children using standardized clinical markers.
Case 3: The O'Reilly Family — Addiction Cycles and Systemic Roles
The **O'Reilly** case study examines the impact of multi-generational Alcohol Use Disorder (AUD). It specifically highlights "Family Roles" that emerge in addicted systems: the **Hero** (Finn), the **Scapegoat** (Roisin), and the **Lost Child** (Callum). Students can observe the intergenerational patterns of cutoff (red bars) and enmeshment (green railway tracks). This case demonstrates how a genogram serves as a diagnostic engine to identify systemic roles that maintain clinical symptoms.
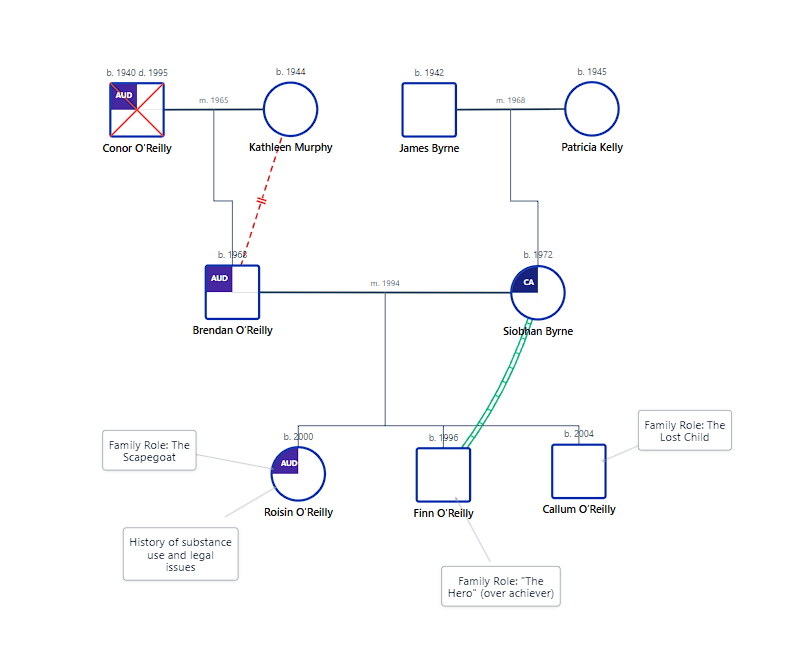
Figure 3: Mapping intergenerational addiction, toxic family roles, and emotional cutoffs in the O'Reilly system.
Tools, Security, and professional optimization
While manual drafting was once the standard in clinical training, modern programs increasingly advocate for digital optimization. Platforms like Genosm provide a dedicated "palette" of drag-and-drop clinical components designed specifically for university assignments. This allows students to focus on high-level clinical conceptualization rather than the logistics of manual drawing. The result is a cleaner, more professional, and technically accurate submission that meets the highest academic standards.
Digital efficiency is further enhanced through AI-augmented generation. Students can input familial narratives in plain language and have a valid genogram generated in seconds. This automation respects the professional symbology rules while dramatically reducing the time required for administrative drafting. This efficiency is critical for trainees managing high academic loads and multiple internship cases simultaneously.
Data security and privacy are non-negotiable requirements, even for academic exercises. Sensitivity regarding family information remains constant whether the data is for a real client or a student assignment. Genosm utilizes a local-first design where all personally identifiable information (PII) is stored directly on the student’s device. This architecture ensures that data never touches centralized third-party servers, meeting the highest privacy standards by design.
Conclusion, The transition to Professionalism
The genogram assignment is the bridge between clinical theory and professional assessment. By moving beyond linear family trees and adopting a multigenerational visual standard, healthcare trainees gain the precision needed to identify risk, hypothesize systemic causes, and promote holistic health outcomes. This methodology is the foundation of high-authority professional practice.
Master Your Genogram Assignment
Create clinical-grade maps with Genosms AI palette.
View Student Plans