A professional, secure, and intuitive tool designed for modern social workers, case managers, and
family therapists.
Map complex client systems, visualize support networks, and identify intervention points—all
directly in your browser without data privacy concerns.
Local Privacy First No
Registration Needed
Instant PNG Export
About This Tool
Genosm's Free Ecomap Maker is designed to democratize access to high-quality
clinical documentation tools.
Whether you are a licensed clinical social worker (LCSW), a marriage and family therapist (LMFT), a
nurse case manager, or a psychology student,
visualizing ecological systems shouldn't require expensive software.
Our tool supports standard ecomapping protocols used in social work assessments,
nursing care plans, and family systems therapy.
Compatible with all modern browsers (Chrome, Edge, Safari, Firefox).
Theoretical Foundations: Urie Bronfenbrenner
& Ann Hartman
The clinical ecomap is a structural assessment instrument originally developed by Ann
Hartman in 1978 (Hartman,
1978) to help caseworkers, family therapists, and counselors map the ecological context of
individuals and families. The concept is deeply grounded in Urie Bronfenbrenner's Social
Ecological Systems Theory (Bronfenbrenner,
1979), which views human development as affected by five nested environmental layers:
1. The Microsystem
The immediate, face-to-face settings the client interacts with daily, such as their
immediate family, household, workplace, or school environment.
2. The Mesosystem
The linkages and interactions between the client's different microsystems (e.g.,
coordination between the school counselor, parents, and healthcare providers).
3. The Exosystem
Settings that affect the client indirectly, even if they do not contain the client (e.g.,
parental workplace regulations, community health networks, neighborhood safety).
4. The Macrosystem
The overarching cultural paradigms, economic conditions, political values, social
expectations, and laws that govern how community resources are structured.
5. The Chronosystem
The temporal dimension; transitions, historical moments, and change cycles (e.g., divorce,
changing jobs, relocating) that reshape the ecosystem over time.
Clinical Citation Note: Ann Hartman's pioneering paper "Diagrammatic assessment of
family relationships" published in 1978 in the journal Social Casework remains the core
reference text for ecomapping, now a standard diagnostic requirement endorsed by the National
Association of Social Workers (NASW) and the Council on Social Work Education
(CSWE).
Clinical Comparison: Ecomaps vs. Genograms
While both family genograms and ecological maps are standard diagrammatic assessment tools in social
work and systemic therapy, they provide complementary yet completely distinct viewpoints:
Dimension
Clinical Genogram
Clinical Ecomap
Primary Focus
Internal family dynamics,
generational history, hereditary/medical patterns, and genealogy.
External resources, social
connections, community networks, and institutional relationships.
Time Axis
Vertical (diachronic) —
maps changes, behaviors, and inheritance patterns across 3+ generations.
Horizontal (synchronic) —
maps the current relational snapshot of the client in their active environment.
Strength of environmental
resources, directional resource flows, stress points in social networks.
Free
Forever
Why Use This Ecomap Maker?
Built for speed, privacy, and professional presentation. No credit card required, ever.
100% Private & Secure
Local-First Architecture: Your client data never leaves your browser. We
don't have servers to store your sensitive information, ensuring instant HIPAA-friendly
privacy.
Drag & Drop Simplicity
Intuitively organize complex systems. Simply drag nodes to rearrange the map, and our
smart layering engine keeps connections clean and readable.
Professional Export
One-click High-Res PNG export. Perfect for attaching to electronic health
records (EHR), court reports, or case management files.
Clinical Symbology
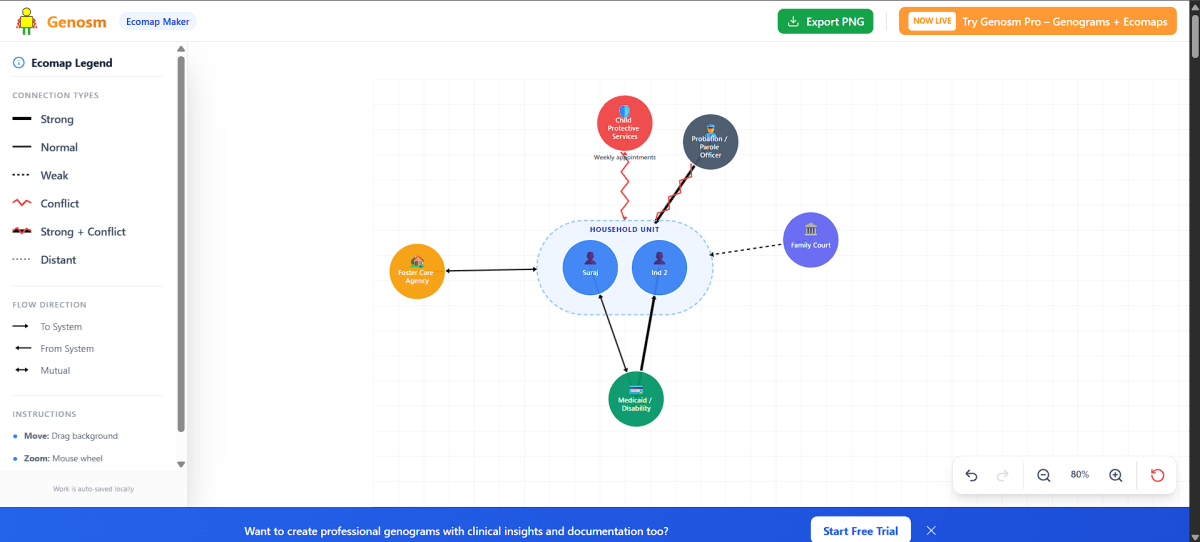
Pre-loaded with standard social work symbols: strong
lines for support, jagged lines for
conflict, and dashed lines for tenuous bonds.
Undo/Redo & Auto-Save
Made a mistake? unlimited undo/redo history lets you experiment freely. Plus, your work
auto-saves to your local browser storage instantly.
Custom Systems
Don't see a category you need? Add Custom Systems with your own labels to
map unique resources like "Online Support Group" or "Pet Therapy".
Multi-Member Household Units
Map up to 3 individual family members inside the central household
enclosure. Customize labels (e.g., Rajesh, Suresh, Ramesh) for granular microsystem
assessments.
Targeted Connection Logic
Connect external systems either to the entire Household Unit as a whole
(attaching cleanly at the boundary edge) or directly to specific individual
members inside the unit.
System Notes & Annotations
Add clinical notes directly during the 4-Step Creation Wizard or edit modal
(e.g. appointment times, caseworker contact details, status notes), displayed cleanly under
each node.
Multi-Person System Connections
Connect the same external system (e.g., Guardian ad Litem or Family Court)
to multiple different household members independently, each with distinct relationship line
styles and energy flows.
Complete Guide to Ecomaps in Clinical Practice
What is an Ecomap and Why Use One?
An ecomap (ecological map) is a powerful visual assessment tool developed by
Dr. Ann Hartman in 1975 to depict the ecological context of a family or individual. Unlike a genogram which maps
internal family history and genetics, an ecomap visualizes the dynamic relationships
between a client and their external world.
It places the individual or family unit at the center and maps out connections to various
systems such as:
Social Institutions: Schools, churches, workplaces
For social workers and therapists, ecomaps are indispensable for:
Assessment Phase
Quickly identify social isolation, resource deficits, or overwhelming
stress. It provides a "snapshot" of the client's current reality.
Intervention Planning
Highlight strengths to leverage (e.g., a supportive church group) and
conflicts to address (e.g., stressful workplace).
Progress Monitoring
Compare ecomaps from intake vs. discharge to visualize expanded support
networks and reduced stressors.
Client Engagement
Co-creating an ecomap empowers clients to see their own lives
objectively, often reducing shame and increasing agency.
How to Read an Ecomap: Standard Symbols
This tool uses standard social work symbology to ensure your diagrams are professionally
recognized:
Line Style
Meaning
Intervention Implication
Strong / Positive
A reliable source of support to maintain.
Tenuous / Weak
A relationship that may need strengthening or
is fading.
Stressful / Conflictual
A drain on energy; requires boundary setting
or conflict resolution.
→ or ←
Energy Flow
Shows reciprocity. Is the client only giving
(draining) or only receiving (dependent)?
Advanced Ecomapping Capabilities
Genosm's Ecomap Maker supports advanced clinical modeling scenarios required in modern casework:
Household Unit vs. Individual Targeting
When a resource benefits or affects the entire family (such as Housing
Authority or SNAP Food Benefits), connect it to the Household
Unit. The connection line automatically attaches to the outer boundary
enclosure. When a resource targets a specific individual (such as a Primary Care
Doctor or School Counselor), connect it directly to that member's
node.
Connecting One System to Multiple Persons
The same external system (e.g. Guardian ad Litem or Child Protective
Services) can be connected simultaneously to multiple individual household
members (or to both the whole household unit and a specific child), depicting nuanced,
multi-faceted relationships.
Clinical Notes & Schedule Annotations
Systems can carry custom clinical notes (e.g., "Weekly Appointments - Case Mgr: Jane
Doe"). Notes appear directly beneath the system node on the ecomap canvas,
providing vital context for multidisciplinary care teams.
4-Step Guided Wizard
Adding systems is guided step-by-step: 1) System Type, 2) Relationship Symbology, 3)
Energy Flow Direction, and 4) Optional Clinical Notes & Label Customization.
Real-World Case Examples
Case 1: Child Welfare & Foster Care
Scenario: 10-year-old "Leo" entering foster care. Ecomap Focus: Mapping safe adults, school connections, and biological
family access. Value: Helps the caseworker preserve existing stability (e.g., keeping the
same soccer coach) while identifying gaps in emotional support.
Case 2: Geriatric Care Management
Scenario: 78-year-old "Maria" living alone with early dementia. Ecomap Focus: Identifying informal caregivers (neighbors), medical
providers, and transportation needs. Value: Visualizes the "care web" to prevent caregiver burnout and ensure
safety nets are active.
Case 3: Substance Use Recovery
Scenario: "David" (35) in early recovery from opioid use disorder. Ecomap Focus: Distinguishing "using friends" (stressful/danger) from
recovery community (strong/positive). Value: Concrete visualization of triggers vs. safety zones, critical for
relapse prevention planning.
Step-by-Step Guide: Creating Your First
Ecomap
1
Define the Center System
Always start with the "Family of Origin" or "Index Person" in the center circle. This
represents the client system you are assessing.
2
Add External Systems
Click the center node to add surrounding circles. Choose from categories like Work, School,
or Extended Family. Arrange them intuitively—closer systems for frequent contact.
3
Characterize Connections
Click a connection line to change its type. Ask the client: "Is this relationship
supportive? Stressful? Do you give more than you receive?" Update the line style and arrows
accordingly.
Frequently Asked Questions (FAQ)
Q: How is this different from a Genogram?
A Genogram is a vertical family tree tracking history and
biology over time. An Ecomap is a horizontal snapshot of current relationships and
environment. Social workers often use both together—the genogram for history, the ecomap for
current context.
Q: Is this tool HIPAA compliant?
This free tool runs entirely in your browser (local-first). No
client data is sent to our servers, making it inherently private. For enterprise-grade HIPAA
compliance with zero-knowledge local storage that respects your privacy, check out Genosm Pro.
Q: Can I print the ecomap?
Yes! Use the "Export PNG" button to download a high-resolution
image, which can then be easily printed or pasted into Word documents, Electronic Health
Records (EHR), or case files.
Q: Can I customize the system names?
Absolutely. While we provide standard categories (School, Work,
etc.), you can edit any label or add a "Custom System" to map unique elements like "Pet
Therapy" or "Online Gaming Community".
Q: Can I connect a system directly to a specific person
inside the household?
Yes! You can connect systems directly to an individual member
(e.g., Child 1 or Parent 1) or to the overall Household Unit. Lines connected to individual
members connect directly to their node, while lines connected to the Household Unit attach
cleanly to the outer boundary enclosure.
Q: How do I add clinical notes or appointment details to
a system?
You can add optional notes during Step 4 of the Add System
Wizard when creating a system, or double-click any system node anytime (or click "Edit
Label") to update its notes. Notes display directly beneath the node on the ecomap.
Q: Can the same external system be connected to multiple
family members?
Absolutely. You can draw multiple independent connections from
a single system (like Guardian ad Litem or Family Court) to different household members,
each with its own relationship type (strong, stressful, etc.) and energy flow direction.
Q: Is this suitable for students?
Yes, this tool is widely used by BSW and MSW students for field
practicum assignments because it's free, requires no login, and produces
professional-standard diagrams conforming to NASW guidelines.
Genosm Pro is Now Live!
Ready to take your clinical mapping to the next level?
Genosm Pro integrates powerful Genograms and Ecomaps into one seamless workflow.
Get AI-assisted suggestions, zero-knowledge local storage that respects your privacy, and advanced
relationship analysis.