"Is a genogram the same as a family tree?" "What's the difference between a pedigree chart and a genogram?" "When should I use an ecomap instead?" "Which one do I need for my clinical assessment?"
These questions appear daily in clinical training programs, genetic counseling sessions, and social work case conferences. The confusion is understandable. All four tools use similar visual elements (circles, squares, connecting lines). All map family or social relationships. All appear, at first glance, to serve the same purpose.
The confusion deepens because terminology varies by profession. Therapists speak of genograms, genetic counselors reference pedigrees, social workers create ecomaps, and genealogists build family trees. Each profession has developed its own mapping conventions, yet the underlying symbols often overlap. A square still represents a male. A circle still represents a female. Lines still connect relationships. So what makes them different?
This guide resolves that confusion. You will see side-by-side visual comparisons of the same family mapped in all four formats. You will access downloadable templates created in Genosm. You will learn the specific clinical applications that determine which tool to use. Most importantly, you will understand when to use each tool and when to combine them for comprehensive assessment.
The examples shown here are real genograms, pedigree charts, ecomaps, and family trees created in Genosm. Each demonstrates the distinct purpose and visual language of its format. By the end of this guide, you will know exactly which tool your clinical situation demands.
Quick Comparison: At a Glance
| Feature | Family Tree | Genogram | Pedigree Chart | Ecomap |
|---|---|---|---|---|
| Primary Purpose | Genealogy, ancestry | Family therapy, relationship patterns | Medical genetics, inheritance | Social support mapping |
| Who Uses It | Genealogists, historians | Therapists, counselors | Genetic counselors, physicians | Social workers, case managers |
| Time Span | Multiple generations (5-10+) | 3-4 generations | 3-4 generations | Current snapshot |
| Key Focus | Lineage, heritage | Emotional dynamics, patterns | Genetic conditions, carriers | External systems, resources |
| Symbol Complexity | Basic (names, dates) | Complex (34+ relationship types) | Medical (NSGC-compliant) | Systems + connection strength |
| Clinical Use | Minimal | High (therapy, counseling) | High (genetic counseling) | High (case management) |
| Can Be Combined? | Rarely | Yes (with pedigree/ecomap) | Yes (with genogram) | Yes (with genogram) |
Key Takeaway
While all four tools map family or social relationships, each serves a distinct clinical purpose. Family trees document ancestry. Genograms reveal emotional patterns. Pedigree charts track genetic inheritance. Ecomaps identify external support systems. Modern platforms like Genosm allow you to create all four formats and even combine them for comprehensive assessment.
Family Trees: The Foundation of Genealogical Mapping
What Is a Family Tree?
A family tree is a genealogical diagram that documents biological lineage and ancestry across multiple generations. Unlike clinical mapping tools, the family tree serves a historical rather than therapeutic purpose. It answers questions about heritage, ethnic origins, and family migration patterns. When someone asks "how do I trace my family history" or "what is the best way to document my ancestry," they are describing the core function of a traditional family tree.
The family tree format has existed for centuries, predating modern clinical tools by hundreds of years. Royal families used elaborate tree diagrams to establish legitimacy and succession rights. Today, genealogists and family historians use digital family tree makers to research lineage, often extending back five, ten, or even fifteen generations when historical records permit.
Key Characteristics of Family Trees
The defining feature of a family tree is its focus on biological relationships and chronological documentation. Each person on the tree includes basic biographical data: full name, birth date, death date (if deceased), marriage date, and sometimes location information. The tree structure itself is hierarchical, with the oldest generation at the top or center and descendants branching outward.
Standard Family Tree Elements
- • Biographical data: Names, birth/death dates, marriage dates, locations
- • Generational span: Often 5-10+ generations depending on available records
- • Visual presentation: Decorative elements, photos, ornamental borders
- • Purpose: Heritage documentation, family heirlooms, ancestry research
When to Use a Family Tree
Family trees serve specific non-clinical purposes. Genealogists creating a family tree to document ancestry will prioritize historical accuracy and completeness. The question "should I use a family tree or genogram" depends entirely on your goal. If you are researching your ethnic heritage, documenting immigration patterns, or creating a visual family history for display, a traditional family tree is the appropriate choice.
Common applications include ancestry projects for school assignments, heritage documentation for cultural preservation, genealogical research for historical societies, and creating family heirlooms to pass down through generations. Many people build family trees using online genealogy platforms that connect to historical records databases, census data, and immigration records.
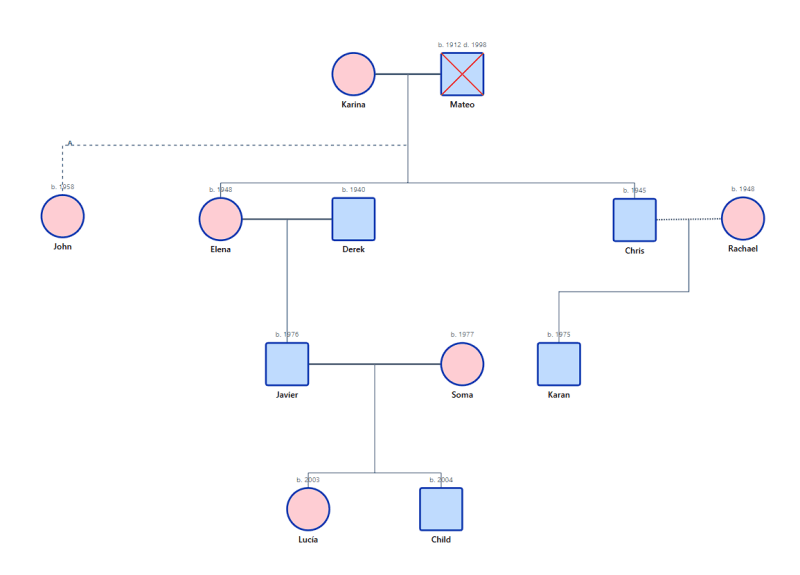
Example: Traditional Family Tree
4 generations showing genealogical lineage

How to Create a Family Tree
Building a family tree follows a systematic process. Whether you are using a free family tree template or a digital family tree maker like Genosm, the steps remain consistent.
Start with yourself or the primary subject
Place yourself (or the person whose ancestry you are documenting) at the base of the tree. This becomes the reference point for all other relationships.
Add immediate family members
Document parents, siblings, spouse, and children. Include full names and dates. This forms the first generation of your family tree diagram.
Expand to grandparents and beyond
Add each set of grandparents, then great-grandparents. Include birth locations and migration information if researching family origins.
Verify information with historical records
Cross-reference birth certificates, census records, marriage licenses, and immigration documents. Accuracy is essential for genealogical research.
In Genosm, you can create a basic family tree structure and export it in multiple formats. While Genosm specializes in clinical genograms and pedigree charts, it supports simple family tree creation for users who need a clean, professional genealogical diagram without complex clinical notation.
Limitations for Clinical Work
The traditional family tree lacks the clinical depth required for therapeutic or medical assessment. It does not capture emotional relationship quality, psychological patterns, or medical conditions. When a therapist asks "what is the difference between a family tree and a genogram," the answer centers on clinical utility. A family tree shows who is related to whom. A genogram shows how those relationships function.
For genetic counseling, a family tree provides insufficient medical detail. It cannot track carrier status, genetic test results, or inheritance patterns. A genetic counselor asking "should I use a pedigree chart or family tree" will always choose the pedigree chart for clinical accuracy. Similarly, social workers conducting case assessments will find that a family tree offers no information about external support systems, making an ecomap the more appropriate tool.
Clinical Perspective
While family trees serve an important role in documenting heritage and ancestry, they are not designed for clinical assessment. Therapists, genetic counselors, and social workers require specialized mapping tools (genograms, pedigree charts, ecomaps) that capture the relational, medical, and systemic data necessary for professional practice. If your work involves clinical assessment, treatment planning, or medical genetics, continue reading to understand which specialized tool fits your needs.
Genograms: Clinical Mapping of Family Dynamics
What Is a Genogram?
A genogram is a clinical assessment tool that maps family relationships, emotional patterns, and intergenerational dynamics across three to four generations. Developed by Murray Bowen as part of family systems theory, the genogram extends beyond simple lineage documentation to reveal how family members relate to one another emotionally, psychologically, and behaviorally.
When therapists ask "what is a genogram used for in therapy," the answer centers on pattern recognition. A genogram makes visible the invisible structures that shape family functioning. It identifies triangulation, emotional cutoffs, multigenerational transmission of trauma, and relationship patterns that repeat across generations. This visual representation allows both clinician and client to see patterns that narrative descriptions often obscure.
The genogram has become standard practice in marriage and family therapy, clinical social work, substance abuse treatment, and mental health counseling. Professional organizations including the American Association for Marriage and Family Therapy (AAMFT) and the National Association of Social Workers (NASW) recognize genograms as an essential clinical competency.
Key Characteristics of Genograms
Unlike family trees, genograms document the quality and nature of relationships. A solid line between parent and child indicates biological connection, but additional notation reveals whether that relationship is close, distant, conflicted, or enmeshed. Genogram symbols for relationships include over 34 distinct types in comprehensive systems like Genosm, allowing clinicians to map the full spectrum of human connection.
Essential Genogram Components
- • Generational scope: Typically 3-4 generations (grandparents, parents, children, grandchildren)
- • Emotional relationships: Close, distant, conflicted, enmeshed, cutoff (34+ types in Genosm)
- • Clinical markers: Substance abuse, mental health conditions, significant life events
- • Temporal data: Births, deaths, marriages, divorces, migrations with dates
- • Cultural context: Religion, ethnicity, immigration history, cultural identity
When to Use a Genogram
Genograms serve multiple clinical purposes across therapeutic modalities. In family therapy, a genogram provides the foundational assessment during intake. The process of creating a genogram with a family reveals communication patterns, power dynamics, and areas of conflict or alliance. Couples counselors use genograms to identify how each partner's family of origin influences current relationship patterns.
Substance abuse treatment programs employ genograms to track intergenerational patterns of addiction. When a clinician asks "how do you identify patterns in a genogram," they are looking for repeated themes across generations such as alcoholism in every generation of males, or a pattern of women becoming primary caretakers for extended family. These patterns inform treatment planning and help clients understand their behavior within a larger family context.
Mental health professionals use genograms to assess for inherited vulnerabilities to depression, anxiety, or other psychiatric conditions. The genogram documents not just diagnoses but also coping mechanisms, resilience factors, and sources of family strength. This balanced view prevents pathologizing while maintaining clinical accuracy.
Example: Clinical Genogram
4 generations showing emotional relationships and clinical markers

Genogram Symbols and Notation
Understanding genogram symbols is essential for both creating and interpreting these clinical maps. Basic shapes follow standardized conventions: squares represent males, circles represent females, and other shapes accommodate diverse gender identities. Lines connecting individuals indicate relationship types and quality.
Relationship Line Types
- Double line: Close or fused relationship
- Jagged line: Conflicted or hostile relationship
- Dashed line: Distant or estranged relationship
- Line with slash: Cutoff (no contact)
- Triple line: Enmeshed relationship
Clinical Markers
- Filled shape: Identified patient or index person
- X through shape: Deceased individual
- Internal symbols: Substance abuse, mental health
- Annotations: Significant events, diagnoses
- Color coding: Pattern highlighting (optional)
Genosm implements the McGoldrick-Gerson standard for genogram symbols while extending the system to include 34 distinct emotional relationship types. This allows for nuanced clinical documentation that captures the full complexity of family dynamics. When creating a genogram in therapy, clinicians can select from relationship types including "close but conflicted," "protective," "manipulative," "abusive," and many others that reflect real-world relational patterns.
How to Create a Genogram
The process of genogram creation is itself therapeutic. As clients describe family members and relationships, they externalize internal family maps and often gain new insights. Whether using a genogram template for therapy or a digital tool like Genosm, the steps follow a consistent clinical framework.
Identify the index person or identified patient
Begin with the client or the person who is the focus of treatment. This individual becomes the reference point for mapping all other family relationships.
Map the immediate family system
Add parents, siblings, spouse or partner, and children. Document basic information (names, ages, occupations) and note the quality of each relationship using appropriate line types.
Extend to previous generations
Add grandparents and great-grandparents as information permits. Include deceased family members, marking them with an X. Document significant relationships even if individuals are no longer living.
Document emotional relationships
This is where genograms differ from family trees. Add relationship quality indicators: close, distant, conflicted, cutoff. Ask the client to describe each significant relationship.
Note significant events and patterns
Mark deaths, divorces, migrations, traumatic events. Add clinical markers for substance abuse, mental health conditions, chronic illness. Include dates to establish temporal patterns.
Identify and highlight patterns
Look for repetition across generations. Triangulation, parentification, scapegoating, and other systemic patterns become visible when mapped. These patterns inform treatment planning.
Add clinical notes and observations
Use Genosm's annotation features to document clinical hypotheses, treatment goals, and areas requiring further exploration. The genogram becomes a living clinical document.
Clinical Applications and Use Cases
Genograms reveal patterns that inform clinical intervention. In couples therapy, genograms often show how each partner replicates or rebels against their family of origin patterns. A woman who grew up with an emotionally distant father may unconsciously choose a similar partner, or she may choose the opposite and then struggle with intimacy. The genogram makes these patterns explicit and discussable.
Substance abuse counselors use genograms to identify intergenerational addiction patterns. When a client sees that alcoholism appears in every generation on the paternal side, it contextualizes their own struggle and reduces shame. The genogram also identifies family members who achieved recovery, providing models of resilience.
In child and adolescent therapy, genograms help young clients understand that family problems are systemic, not their fault. A child acting as a parentified caregiver can see on the genogram that this pattern existed before they were born. This externalization is therapeutically powerful.
Integration with Other Tools
Genograms can be combined with other clinical mapping tools for comprehensive assessment. A genogram paired with an ecomap provides both internal family dynamics and external support systems. A genogram combined with a pedigree chart addresses both emotional patterns and genetic inheritance. Genosm supports these integrated approaches, allowing clinicians to layer multiple perspectives on a single family system.
Professional Genogram Resources
Mastering the clinical genogram requires both theoretical knowledge and practical tools. Access our comprehensive library of validated genogram resources:
Pedigree Charts: Medical Genetics and Inheritance Mapping
What Is a Pedigree Chart?
A pedigree chart is a medical diagram that tracks genetic conditions and inheritance patterns across multiple generations. Standardized by the National Society of Genetic Counselors (NSGC), pedigree charts serve as the primary assessment tool in clinical genetics, genetic counseling, and medical genetics research. Unlike genograms that focus on emotional dynamics or family trees that document ancestry, pedigree charts answer a specific question: what is the pattern of genetic inheritance in this family?
When a genetic counselor asks "how do you draw a pedigree chart," they are referencing a precise set of NSGC-standardized symbols and conventions. These standards ensure that any genetic professional can interpret a pedigree chart created by another clinician. The pedigree chart uses specific notation for affected individuals, carriers, genetic testing results, and inheritance patterns (autosomal dominant, autosomal recessive, X-linked, mitochondrial).
Pedigree charts are essential in cancer genetics, rare disease diagnosis, prenatal counseling, and family planning decisions. They allow genetic counselors to calculate recurrence risks, recommend appropriate genetic testing, and identify at-risk family members who may benefit from screening or preventive interventions.
Key Characteristics of Pedigree Charts
The defining feature of a pedigree chart is its focus on medical and genetic information. Each individual on the chart is evaluated for the presence or absence of specific genetic conditions. Affected individuals are shown with filled shapes. Carriers (individuals who have one copy of a recessive gene but do not express the condition) are indicated with a center dot. Genetic test results are marked with specific notation.
NSGC-Compliant Pedigree Elements
- • Affected status: Filled shapes indicate individuals with the genetic condition
- • Carrier status: Center dot for heterozygous carriers of recessive conditions
- • Multiple conditions: Quadrant shading (2-4 conditions) or vertical bands (5+ conditions)
- • Genetic testing: 'E' marker with positive (+), negative (-), or uninformative (?) results
- • Proband identification: Arrow pointing to the individual seeking genetic counseling
When to Use a Pedigree Chart
Pedigree charts are the standard tool for genetic counseling sessions. When a patient presents with a family history of cancer, a genetic counselor will construct a pedigree chart to assess hereditary cancer risk. The question "should I use a pedigree chart or genogram for genetic counseling" has a clear answer: pedigree charts are designed specifically for medical genetics assessment and follow standardized medical notation.
Cancer genetics programs use pedigree charts to identify families with hereditary breast and ovarian cancer (BRCA mutations), Lynch syndrome (hereditary colorectal cancer), or Li-Fraumeni syndrome. The pedigree reveals patterns such as early-onset cancers, multiple affected individuals across generations, or specific cancer types that suggest genetic predisposition.
Prenatal genetic counselors use pedigree charts when couples are planning pregnancy or following abnormal prenatal screening results. The pedigree helps identify carrier status for conditions like cystic fibrosis, sickle cell disease, or Tay-Sachs disease. Rare disease specialists use pedigrees to diagnose conditions that may not have been previously identified in the family, using the inheritance pattern to guide genetic testing strategies.
Example: NSGC-Compliant Pedigree Chart
4 generations tracking X-linked Dominant inheritance pattern

NSGC Pedigree Symbols and Standards
The National Society of Genetic Counselors maintains standardized pedigree nomenclature to ensure consistency across clinical practice. Understanding these pedigree symbols is essential for anyone working in medical genetics or genetic counseling.
Affected Status Notation
- Fully filled: Affected with the condition
- Half filled (left): Affected with first condition
- Quadrant shading: 2-4 different conditions
- Vertical bands: 5 or more conditions
- Diagonal line: Obligate carrier (must carry gene based on pedigree)
Genetic Testing Results
- E+: Positive genetic test result
- E-: Negative genetic test result
- E?: Uninformative or variant of uncertain significance
- No E: Not tested or testing status unknown
- Arrow: Proband (person seeking counseling)
How to Create a Pedigree Chart
Creating a pedigree chart for genetic counseling follows a systematic medical protocol. The process requires detailed family history collection and precise application of NSGC standards.
Identify the proband
Begin with the individual seeking genetic counseling. Mark this person with an arrow. This is the reference point for calculating genetic risks and inheritance patterns.
Map biological relatives systematically
Document all biological relatives. Adoption and step-relationships are noted differently. Include parents, siblings, children, and extend to grandparents, aunts, uncles, and cousins as relevant to the genetic question.
Document all known medical conditions
For each family member, note diagnoses, age at diagnosis, and current age or age at death. Use NSGC-standard shading to indicate affected status. Be specific about condition names (use OMIM terminology when possible).
Indicate carrier status where known
Mark confirmed carriers with a center dot. Mark obligate carriers (those who must carry a gene based on pedigree analysis) with diagonal lines. This is critical for recurrence risk calculation.
Add genetic test results
Use 'E' notation to mark individuals who have undergone genetic testing. Specify positive (E+), negative (E-), or uninformative (E?) results. Include gene names and specific variants when known.
Analyze inheritance pattern
Determine if the pattern is autosomal dominant, autosomal recessive, X-linked, or mitochondrial. Genosm provides automatic inheritance pattern detection based on the pedigree structure and affected status.
Generate clinical summary
Use the pedigree to calculate recurrence risks, identify at-risk relatives, and recommend genetic testing strategies. The pedigree becomes the foundation for genetic counseling and medical management decisions.
Integration with Genosm: OMIM and Clinical Features
Genosm integrates with the Online Mendelian Inheritance in Man (OMIM) database, allowing genetic counselors to search for conditions by name or OMIM number. When you add a genetic condition to a pedigree in Genosm, the system retrieves clinical information, inheritance patterns, and phenotype data from OMIM. This ensures accurate medical terminology and provides instant access to condition details.
The pedigree chart maker in Genosm automatically detects inheritance patterns based on affected individuals and family structure. If the pedigree shows affected individuals in every generation with male-to-male transmission, Genosm identifies this as likely autosomal dominant. If only males are affected and the condition passes through unaffected carrier females, the system suggests X-linked recessive inheritance.
Clinical Accuracy in Medical Genetics
Pedigree charts require medical precision. A pedigree chart vs genogram comparison reveals that while genograms focus on relationship quality and emotional patterns, pedigree charts document medical facts: diagnoses, ages at onset, genetic test results, and inheritance patterns. For genetic counseling, cancer risk assessment, or rare disease diagnosis, the pedigree chart is the essential clinical tool. Genosm's NSGC-compliant pedigree features ensure that genetic professionals can create medically accurate pedigrees that meet clinical standards.
Ecomaps: Visualizing Social Support and External Systems
What Is an Ecomap?
An ecomap is a systemic assessment tool used to visualize the relationship between an individual or family and their social environment. Developed by Ann Hartman in 1975, the ecomap represents the social ecology of the family. It identifies connections to external systems including schools, workplaces, healthcare providers, religious institutions, and community resources. While genograms map internal family dynamics, the ecomap identifies how the family interacts with the broader ecological system.
When social workers ask "what is an ecomap in social work," the answer focuses on assessing resource accessibility and the quality of social supports. The tool identifies where resources are abundant and where stressors originate. This visual representation of safe and unsafe environments provides a comprehensive view of the family's social world. In clinical practice, the ecomap serves as a bridge between individual assessment and environmental intervention.
The ecomap differs from a genogram by focusing on external rather than internal relationships. A genogram maps biological and emotional patterns within the family. An ecomap identifies the inflow and outflow of energy between the family and external institutions. This tool is essential for understanding how environmental factors influence family functioning.
Key Characteristics of Ecomaps
The primary feature of an ecomap is its graphical representation of social connections. The nuclear family or individual is placed in a central circle. Surrounding circles represent specific external systems such as work, school, health services, and extended social networks. Lines connect these systems to the family, with specific notation describing the nature of each connection.
Essential Ecomap Components
- • Central system: The individual or nuclear family (often shown as a simplified genogram)
- • External systems: Circles representing agencies, institutions, and community groups
- • Connection strength: Visual notation indicating strong, weak, or tenuous bonds
- • Directional flow: Arrows showing the direction of resources or energy exchange
- • Stressors: Specific notation identifying sources of conflict or environmental pressure
When to Use an Ecomap
Social support mapping is a primary use Case for ecomaps. This tool is particularly effective when assessing families in crisis or those requiring intensive case management. When professionals ask "how to create an ecomap," they are typically seeking a way to document a client's available resources for foster care assessments, hospital discharge planning, or disability support services.
In child welfare, ecomaps help identify kinship placements by visualizing the parents' broader social network. They reveal hidden support systems, such as a neighbor or a religious mentor, who can assist during family reunification. For mental health clinicians, the ecomap identifies external stressors that may be exacerbating internal family problems. This systemic view prevented the isolation of clinical issues from the social context.
Healthcare providers use ecomaps to evaluate the social determinants of health. A patient with a chronic condition may have a strong medical connection but a stressful housing or financial connection. The ecomap makes these environmental factors visible to the entire multidisciplinary team, facilitating comprehensive treatment planning.
Example: Clinical Ecomap
Social ecology assessment identifying supports and stressors

Ecomap Symbols and Connection Quality
The visual language of the ecomap provides a snapshot of the family's ecological health. Standardized line types allow clinicians to communicate complex social data efficiently.
Connection Line Standards
- Thick solid line: Strong, positive connection or support
- Thin solid line: Weak or tenuously maintained connection
- Jagged line: Stressful, conflicted, or negative connection
- Dashed line: Distant or inactive but meaningful bond
- Directional arrow: Flow of resources, energy, or money
External Resource Domains
- Formal Systems: Child welfare, courts, medical providers
- Economic Systems: Employment, financial aid, public benefits
- Educational Systems: Schools, vocational training
- Social Systems: Friends, social clubs, recreational groups
- Natural Support: Religious communities, extended kins
How to Create an Ecomap
The creation of an ecomap is a collaborative assessment process. It allows the client to externalize their social world and identify gaps in their support network. When using a professional tool like Genosm, the process involves several systematic steps.
Establish the central system
Place the individual or nuclear family in a large central circle. Use basic genogram symbols to identify members within the home. This becomes the focal point of the ecological assessment.
Identify external systems and agencies
Draw circles around the central system for every significant external influence. Common entries include workplace, schools, healthcare providers, and social agencies involved with the family.
Map the quality of connections
Connect the external circles to the central family. Use specific line types for strong, weak, or stressful relationships. This identifies the qualitative nature of the social support network.
Analyze energy and resource flow
Use arrows to indicate the direction of the relationship. Some systems drain family energy while others provide support. This analysis is critical for resource allocation and planning.
Review resource gaps and strengths
Evaluate the completed ecomap. Identify missing supports or areas where stress is concentrated. Use these findings to inform case goals and community referrals.
Ecological Assessment in Social Work
Ecomaps are vital for the person-in-environment (PIE) perspective. This framework posits that individuals cannot be understood apart from their environmental context. The ecological assessment social work approach uses ecomaps to visualize the complex interplay between personal struggles and systemic barriers. It moves the clinical focus from personal pathology to environmental adaptation and social change.
Genosm supports this systemic perspective by integrating ecomap layers with genogram functionality. Clinicians can transition from internal family mapping to external support mapping on a single canvas. This integrated view provides a comprehensive assessment of both the family of origin patterns and current environmental realities.
Professional Insight
The ecomap provides a dimension of assessment that genograms and pedigree charts do not capture. It focuses on the current social world and environmental resources of the family. For practitioners in social work and case management, the ecomap is a standard tool for ecological assessment. Genosm's features allow professionals to create high-quality, clinical ecomaps that document social support and environmental stressors with precision.
Try our Free Ecomap Maker to start mapping community support systems today.
Side-by-Side Comparison: Same Family, Different Perspectives
To illustrate the unique value of each tool, we'll examine the same family through four different lenses. Each visualization reveals distinct aspects of family functioning—from historical lineage to emotional dynamics, medical genetics, and social support systems. This demonstrates how different clinical contexts require different mapping approaches.
Focus: Historical lineage and biological identity. Documents ancestry and generational connections across multiple family lines.

Focus: Relational dynamics and emotional patterns. Reveals relationship quality, emotional connections, and intergenerational behavioral patterns for therapeutic assessment.

Focus: Inheritance and health risk. Tracks genetic conditions, carrier status, and testing results using NSGC-standard notation for medical genetics assessment.

Focus: Environmental context and resources. Maps connections to external systems like schools, workplaces, healthcare, and community supports to assess social ecology.
This analysis demonstrates that no single tool provides the complete picture. Each visualization serves a distinct clinical purpose: the family tree documents heritage, the genogram reveals relationship dynamics, the pedigree chart tracks genetic inheritance, and the ecomap assesses environmental supports. For comprehensive clinical assessment, combining these tools provides the most thorough understanding of family functioning.
Interactive Tool Comparison
| Feature | Genogram | Pedigree Chart |
|---|---|---|
| Primary Focus | Emotional patterns | Genetic inheritance |
| Clinical Use | Family therapy | Genetic counseling |
| Primary User | Psychologists | Medical Professionals |
| Symbol Standard | McGoldrick-Gerson | NSGC Standards |
Choosing the Right Tool: A Decision Framework
Selecting the appropriate mapping tool depends on your primary objective and professional discipline. Use the following "Case and Choose" framework to determine which assessment tool fits your current clinical or research needs.
Environmental Stress and Resource Gaps
"I am working with a family in the child welfare system. They are struggling with housing instability and have limited natural supports. I need to identify which community agencies are involved and where the family is experiencing the most environmental pressure."
Conclusion: Choose an Ecomap because:
- It identifies the specific agencies (CPS, housing authority, legal aid) involved with the family.
- It visualizes the "jagged" stressful lines connecting the family to these institutions.
- It reveals the flow of energy to identify if the family is overextended by external demands.
- It highlights the missing connections where community support should be present.
Intergenerational Relational Patterns
"A couple is seeking counseling for chronic conflict. Both partners describe similar patterns of triangulation and emotional cutoff in their families of origin. I need to map these emotional relationship types across three generations to identify recurring themes."
Conclusion: Choose a Genogram because:
- It uses standardized symbols for emotional relationship lines (cutoff, fused, conflicted).
- It tracks behavioral patterns and mental health history across generational lines.
- It enables the identification of triangulated relationship structures within the family system.
- It provides a visual map of the "internal" family system and its psychosocial functioning.
- It facilitates client insight into how past family dynamics influence current behavior.
Genetic Inheritance and Cancer Risk
"A patient presents with a strong family history of early-onset breast and ovarian cancer. I need to track which relatives have been affected and document their specific genetic testing results to determine the inheritance pattern."
Conclusion: Choose a Pedigree Chart because:
- It utilizes NSGC-standard quadrant shading to identify specific cancer conditions.
- It incorporates the 'E' marker system to document positive or negative genetic test results.
- It identifies the proband (starting patient) to anchor the clinical medical history.
- It allows for the calculation of recurrence risk based on Mendelian inheritance patterns.
Biographical Identity and Lineage
"An individual wants to document their biological lineage for a family reunion. They are focused on tracing their surname and identifying distant cousins and ancestors across the last two centuries."
Conclusion: Choose a Family Tree because:
- It prioritizes names, birth dates, and geographical locations over clinical data.
- It handles large datasets including hundreds of distant relatives and ancestors.
- It focuses on the historical preservation of the family line and biological heritage.
The Power of Integration
Professionals often find that combining these tools provides the most robust assessment. Digital platforms like Genosm allow you to layer these functionalities. You can start with a genogram for emotional mapping and add pedigree overlays for medical tracking, all while integrating ecomap connections for environmental context. This cross-disciplinary approach is the hallmark of modern professional assessment.
One Unified Platform for All Your Mapping Needs
Genosm empowers you to create Family Trees, Genograms, Pedigree Charts, and Ecomaps as standalone clinical tools or integrated layers within a single systemic view.
Recommended Reading
Why Genograms Matter in Clinical Practice
Learn how visual family mapping reveals intergenerational patterns that text-based notes miss.
Adoption in Genograms: A Clinical Guide
A clinical guide to mapping complex adoption stories, foster care transitions, and biological connections.