When a client walks into a therapy room or a student sits down to map a complex family history, the vertical lines on a page suddenly carry immense weight. A family is rarely just a collection of names and dates. It is a living system where children arrive through different doors. Some are born into the family while others are welcomed through adoption or foster care. Professional tools like Genosm allow you to capture these nuances with technical precision, ensuring that no detail of the family story is lost.
There are times when two or three children arrive at once, bringing the unique dynamics of twins or triplets into the household. Understanding these paths is not about following rigid rules for the sake of a clean diagram. It is about capturing the truth of a human story. A solid line represents one history, while a dashed line for adoption or a dotted line for foster care tells an entirely different story of attachment and transition.
Getting these symbols right ensures that every person in the system is seen and recognized for who they truly are. This guide walks through every child notation, from standard biological links to the complex geometry of multiple births. It provides the clarity needed so that every genogram can be as accurate and relatable as the families it represents. Using an advanced platform like Genosm Pro ensures these symbols are generated automatically, maintaining clinical standards across every chart.
Why Clinical Documentation of Child Types Matters
A genogram is more than a simple family tree because it functions as a clinical diagnostic tool. When a practitioner takes the time to document the exact nature of a child relationship, they are gathering data that informs every future assessment. The distinction between a biological connection and an adoptive or foster care link provides immediate insight into the potential attachment history and systemic loyalties of the individual.
In medical contexts, these notations are critical for tracking hereditary conditions and genetic risk factors. If a genogram does not clearly separate biological children from those joined through legal kinship, a physician might misinterpret a family health pattern. Similarly, mapping multiple births like twins or triplets highlights unique psychological dynamics such as enmeshment or sibling rivalry that are often absent in single-birth scenarios. Standardizing these details ensures that the genogram remains a reliable and professional reference for any clinician who reads it.
Child Types in a Genogram
The diversity of modern families requires a visual language that can adapt to different legal and biological realities. Each child type has a specific notation that communicates the nature of their entry into the family system.
1. Biological Child
This is the foundational link in most family systems. It represents a direct genetic connection between a parent and a child. For clinicians, this line is the primary track for medical history and hereditary patterns that might repeat across generations.
To draw this on a genogram, a solid vertical line is dropped from the horizontal partnership bar directly to the child symbol. This solid line communicates a permanent and genetic bond that remains the standard for biological descent in clinical mapping. When building charts in Genosm, these biological links are established by default to ensure maximum clarity for medical history tracking.
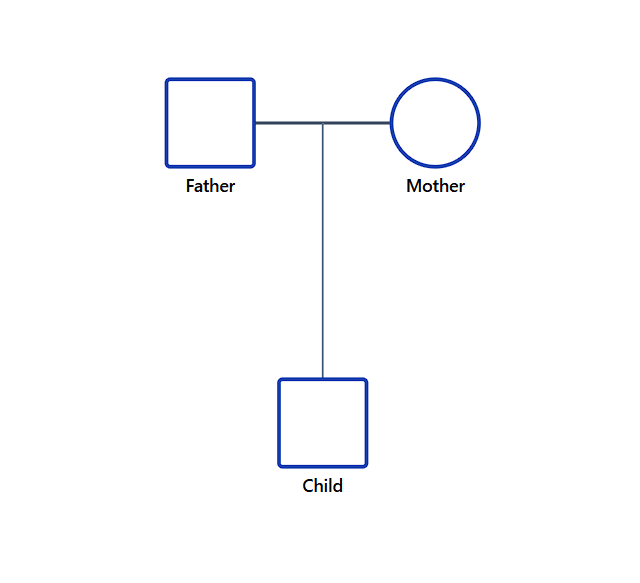
Figure 1: Standard biological child notation showing a solid vertical line connecting to a square or circle.
2. Adopted Child
Adoption brings a child into a family through a legal process rather than a biological one. This notation is vital because it acknowledges the legal permanence of the family unit while noting the absence of a genetic link. It often prompts deeper conversations about identity and chosen family.
The standard way to draw an adopted child is by using a dashed vertical line. To ensure there is no confusion with other relationship types, the capital letter A is placed next to the line. This visual shorthand clearly distinguishes the adoptive status from biological siblings on the same chart.
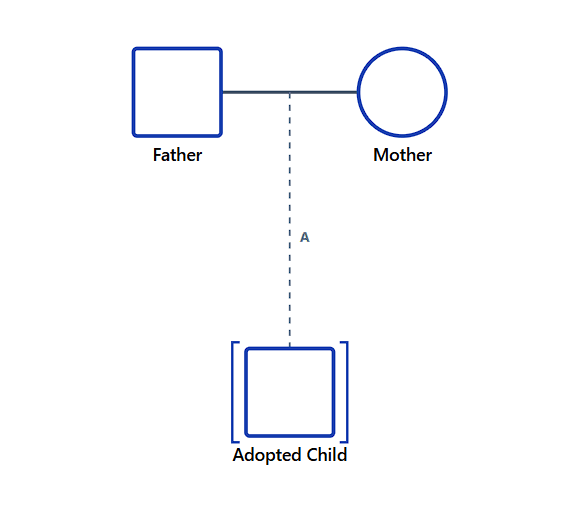
Figure 2: Adopted child notation featuring a dashed vertical line with the letter A indicator.
3. Foster Child
Foster care represents a temporary or transitional placement within a family system. Because these relationships are often governed by external agencies, the notation reflects a connection that is not legally permanent like adoption. It highlights a specific season of care and support.
A foster child is represented by a dotted vertical line connecting to the parent bar. The capital letter F is placed alongside the dots to provide immediate clarity. This dotted pattern visually suggests the transitional nature of the relationship compared to the solid or dashed lines of other siblings.
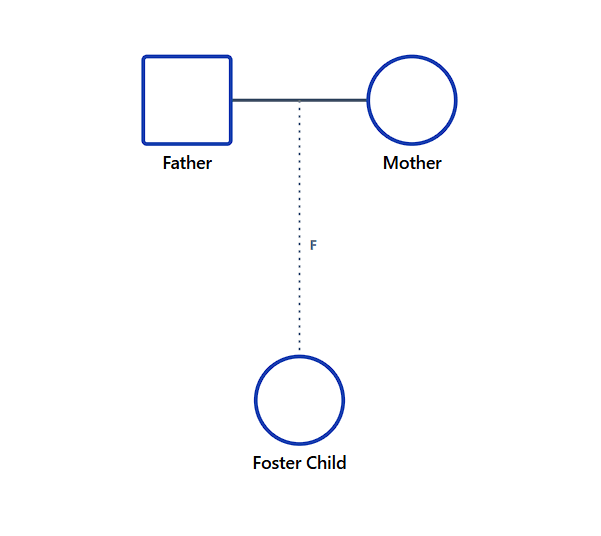
Figure 3: Foster child notation using a dotted vertical line and the letter F for clarity.
4. Legal Guardian
Legal guardianship or kinship care occurs when a child lives with a relative or adult who has legal responsibility but has not adopted them. This is common in grandfamilies where a grandparent might be the primary caregiver. It captures a specific legal status without implying a traditional parental role.
To map this relationship, a dashed vertical line is used similar to adoption, but it is marked with the capital letter L instead of an A. This distinction is critical for legal and social work assessments as it defines the exact nature of the authority and responsibility held by the adult in the system.
Figure 4: Legal guardianship notation showing a dashed line and the letter L to signify kinship care.
5. Surrogate Child
Surrogacy is a modern reality in family mapping that captures the distinction between the person who carries a pregnancy and the intended parents. It is a technically advanced notation that helps track both the biological origin and the social family structure.
In a genogram, a surrogate relationship is often shown with a dashed line connecting the child to the intended parents, marked with the letter Sr. If the biological history is also being tracked, a separate dotted line can connect the child to the surrogate. This dual mapping provides a complete picture of the assisted reproductive journey. Practitioners often use Genosm Pro to manage these multi-layered connections without cluttering the primary family view.
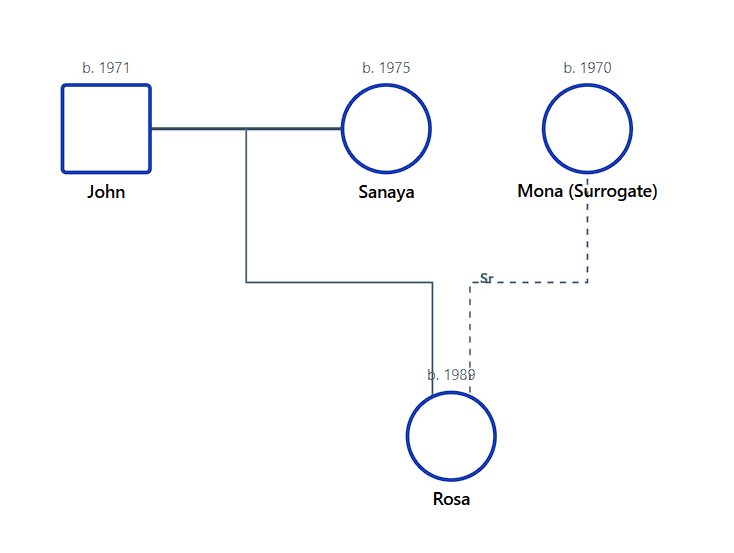
Figure 5: Surrogate child mapping showing the specialized notation for intended parents and biological carriers.
Handling Multiple Births in a Genogram
Multiple births like twins and triplets introduce unique psychological and biological patterns into a family system. Mapping these accurately is essential for understanding sibling dynamics and genetic shared history.
1. Fraternal Twins
Fraternal twins occur when two separate eggs are fertilized by two separate sperm. In a genogram, they are treated as siblings who share the same birth event but have distinct genetic identities. This notation helps clinicians track them as a unique subgroup within the larger sibling array.
To represent fraternal twins, an inverted V shape is drawn originating from a single point on the sibling horizontal bar. Each arm of the V then connects to the individual child symbols. This fanned out structure visually groups the children together while maintaining their separate biological paths.
Figure 6: Fraternal twins notation featuring two lines fanning out from a single apex point.
2. Identical Twins
Identical twins share nearly one hundred percent of their genetic material, which often leads to intense emotional bonds or specific health patterns. The genogram notation for identical twins must emphasize this shared origin to distinguish them from fraternal siblings.
Drawing identical twins starts with the same inverted V used for fraternal twins. However, a horizontal bar is added to connect the two diagonal lines of the V. This horizontal bridge is the technical signal for a shared genetic identity and is a critical detail for medical and psychological assessment.
Figure 7: Identical twins notation showing the inverted V with a horizontal connecting bar.
3. Triplets and Beyond
Triplets and other higher order multiple births follow the fanning logic of the twin notation but extend it to include more individuals. These systems can be even more complex when they involve a mix of identical and fraternal connections within the same birth group.
To draw triplets, three lines are fanned out from a single apex point on the sibling bar. If all three are fraternal, no connecting bars are used. If two of the three are identical, a horizontal bar is placed only between the lines of the identical pair, providing a precise map of the group's genetic relationships.
Figure 8: Triplet notation demonstrating three fanning lines from a single apex.
4. Twins or Triplets with a Stillbirth
Mapping a pregnancy loss or a stillbirth within a multiple birth group is a sensitive but essential part of clinical documentation. It acknowledges the full history of the birth event and the potential psychological impact on the surviving siblings. This notation ensures that the loss is not erased from the family narrative.
To show a stillbirth within twins or triplets, the surviving child is drawn with their standard symbol while the deceased child is marked with an X inside their square or circle. The entire group remains connected by the inverted V structure to show they were part of the same birth. This combination of the multiple birth apex and the mortality symbol provides a clear record of the loss within the group. With Genosm, you can easily toggle mortality markers within multiple birth groups to reflect these sensitive histories accurately.
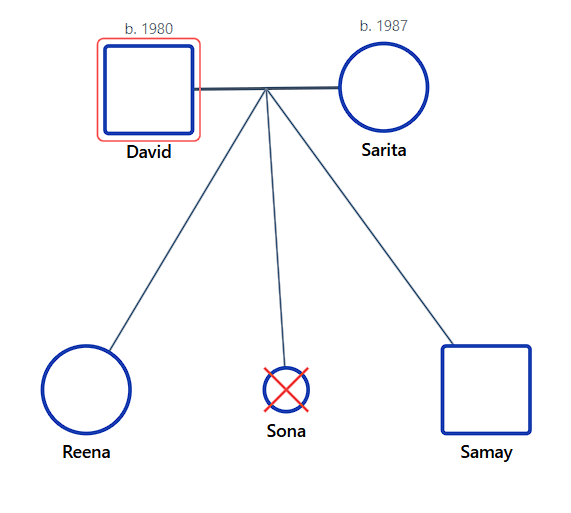
Figure 9: Twin notation showing one surviving child and one stillbirth with an X marker.
Clinical Case Studies: The Child Niche in Practice
The following case studies illustrate how child notations and multiple birth symbols provide critical insights into family dynamics and medical history across three generations.
Case Study 1: The Shadow of the Surviving Twin
This three generation system centers on the Miller family where a historical loss continues to influence current parenting dynamics. The grandmother Margaret lost an identical twin at birth sixty years ago. This stillbirth was never openly discussed but created a pattern of high anxiety regarding child health. Her son David was raised as an only child but struggled with a deep sense of a missing half.
When David and his wife Sarah had triplets, the family system entered a state of hyper vigilance. Two of the triplets are identical while the third is fraternal. The identical pair now exhibits intense enmeshment which David encourages to compensate for his own childhood loneliness. This case demonstrates how a single stillbirth in the first generation can shape the emotional boundaries of multiple births two generations later.
Figure 10: Miller family genogram showing three generations and the intergenerational impact of twin loss.
Case Study 2: The Genetic Puzzle of the Blended System
The Thompson family represents a complex intersection of adoption and biological inheritance. The maternal grandmother Evelyn was adopted as an infant with no known medical history. Her daughter Elena recently gave birth to fraternal twins. One twin has been diagnosed with a rare recessive genetic disorder while the other remains healthy.
Because Elena was also joined to a previous partner through a legal guardianship arrangement for a niece, the household includes biological, adopted, and kinship care children. Mapping this ten person system requires precise child notations to determine which branches are at risk for the genetic condition. The emotional stress of the diagnosis is compounded by the lack of information on the maternal grandmother's biological lineage.
Figure 11: Thompson family genogram illustrating the intersection of adoption, kinship care, and genetic risk.
Case Study 3: The Identity Journey of the Surrogacy Triplets
This case study explores the modern family structure of the Chen-Davis household. The couple used an anonymous egg donor and a surrogate to welcome triplets. Two of these children are identical while the third is fraternal. The system includes the intended parents, the four grandparents, and the three children.
Clinical issues arose when the identical pair began questioning their biological origins differently than their fraternal sibling. The genogram must map the surrogate as a temporary biological link and the donor as a genetic origin while keeping the intended parents as the primary social unit. The emotional tension in the third generation stems from these diverse paths to birth and the unique bond of the identical twins within the triplet group.
Figure 12: Chen-Davis family genogram showing assisted reproduction symbols and triplet dynamics. This complex system was mapped using the Genosm Pro assessment suite.
Conclusion: The Art of Precision
Mapping the child niche in a genogram is about more than just following technical standards. It is about honoring the complexity of how individuals enter a family system. Whether you are documenting a biological birth, a legal adoption, or a multifaceted multiple birth group, every line you draw tells a story of attachment and identity.
By using these standardized notations, you ensure that your clinical assessments are accurate, professional, and deeply relatable to the families you serve. As family structures continue to evolve, the ability to map them with precision remains a vital skill for every modern practitioner. For more detailed information on other symbols, you can explore our comprehensive symbols guide or start building your next case with Genosm Pro today.
Frequently Asked Questions
How do you show a child who is both biological and adopted in a genogram?
If a child is adopted by a relative, you typically use a biological solid line to the birth parents and a dashed line with an A to the adoptive parents to show both histories. This is common in mapping intergenerational systems where kinship care is present.
What symbol is used for a miscarriage within twins?
A miscarriage is shown as a small triangle or a symbol with an X, connected to the same inverted V apex as the surviving twin. This ensures the pregnancy event is fully documented.
How do you denote triplets when two are identical and one is fraternal?
Draw three lines fanning from one point. The two identical siblings are connected by a horizontal bridge, while the third remains unbridged.
Is there a specific symbol for a surrogate mother?
A surrogate is often shown as a separate node connected to the child by a dotted line, while the intended parents are connected by a solid or dashed line. You can easily map this using the specialized tools in Genosm Pro.
How do you represent a long term foster child?
The dotted line with an F remains the clinical standard to distinguish the legal status from permanent adoption, regardless of the duration of the placement.
Can a genogram show an anonymous donor?
Yes, anonymous donors are represented by small symbols or question marks connected by a dotted line to the child to indicate genetic contribution without social parenting.