Picture this. A therapist sits across from a new client who is struggling with anxiety. The client mentions her mother was anxious too. And her grandmother. Three generations of women, all carrying the same invisible weight. The therapist pulls out a blank sheet of paper and starts drawing circles and squares, connecting them with lines. Within twenty minutes, a pattern emerges that neither of them could see before. That is the power of a genogram.
If you have ever wondered what a genogram is, why therapists use them, or how they differ from a simple family tree, this is the place to start. This guide covers everything from the history and symbols to clinical applications and step-by-step creation instructions. Most importantly, it explains why genograms matter in 2026 when there are so many other assessment tools available.
Genograms have transformed therapy sessions for decades, unlocking family secrets and helping clients understand patterns they never knew existed. The difference between a poorly constructed genogram and a well-crafted one is stark. One is just a confusing diagram. The other is a clinical roadmap that guides treatment and reveals insights.
This guide serves everyone. Graduate students learning about family systems theory for the first time will find clear explanations and step-by-step instructions. Seasoned clinicians looking to refine their practice or transition to digital tools will find advanced insights and professional resources. Those simply curious about how genograms work will leave with a solid understanding of this powerful clinical tool.
What is a Genogram?
The Clinical Family Map
A genogram is a visual representation of a family system that goes far beyond documenting who is related to whom. Think of it as a family tree on steroids. Where a traditional family tree shows lineage and ancestry, a genogram reveals the emotional landscape of family relationships. It maps patterns of behavior, psychological dynamics, medical conditions, and the invisible threads that connect one generation to the next.
The key difference is depth. A family tree tells you that John is married to Mary and they have three children. A genogram tells you that John and Mary have a conflicted relationship, that their oldest son is emotionally cutoff from the family, that their daughter is enmeshed with her mother, and that alcoholism appears in every generation on John's side. See the difference?
Genograms typically span three to four generations. This generational scope is not arbitrary. Research in family systems theory shows that patterns tend to repeat across three generations. The trauma your grandmother experienced might be influencing your anxiety today, even if you never met her. The coping mechanisms your father learned from his father might be the same ones causing problems in your marriage. Genograms make these connections visible.
What Makes Genograms Unique
Here is what sets genograms apart from other family mapping tools. They capture multiple layers of information simultaneously. On a single diagram, you can see biological relationships, emotional connections, medical histories, significant life events, cultural backgrounds, and behavioral patterns. This multi-dimensional view is what makes genograms so powerful in clinical practice.
Core Elements of Every Genogram
- • Structural information: Who is in the family, biological relationships, marriages, divorces, births, deaths
- • Emotional relationships: Close, distant, conflicted, cutoff, enmeshed, and 30+ other relationship types
- • Medical and psychological data: Mental health conditions, substance abuse, chronic illnesses, genetic conditions
- • Significant life events: Traumatic experiences, migrations, career changes, major losses
- • Cultural context: Religion, ethnicity, immigration history, cultural identity
Why Therapists Rely on Genograms
Many clinicians start their careers trying to understand family dynamics through narrative alone. Clients describe their families, and the therapist takes notes. The problem is that patterns remain invisible. A client mentions her father was distant, her mother was anxious, her brother was the golden child, and her sister was rebellious. The information gets written down, but the connections stay hidden.
Genograms change this completely. Suddenly, everything becomes visible. The client is triangulated between her parents. Her mother's anxiety matches her grandmother's anxiety. The "golden child" pattern repeats in every generation. The genogram transforms scattered information into a coherent clinical picture.
This is why genograms are considered essential in family therapy training. The American Association for Marriage and Family Therapy (AAMFT) includes genogram competency in their core curriculum. The National Association of Social Workers (NASW) recommends genograms for case assessment. They work because they externalize what is internal. They make the invisible visible.
Example: Clinical Genogram
3 generations showing emotional relationships and patterns
Quick Comparison
A family tree answers "Who is related to whom?" A genogram answers "How do these relationships function?" If you need to document ancestry, use a family tree. If you need to understand family dynamics for clinical work, use a genogram. Want to learn more about the differences? Check out our complete comparison guide.
The History of Genograms: From Bowen to Digital Tools
The 1950s-1960s: Murray Bowen's Family Diagrams
The story of genograms begins with Murray Bowen, a psychiatrist who fundamentally changed how we think about families. In the 1950s, most mental health treatment focused on the individual. If you had anxiety, the problem was inside you. Bowen disagreed. He believed that emotional problems could not be understood in isolation. You had to look at the entire family system.
Between 1954 and 1959, while working at the National Institutes of Mental Health, Bowen developed what he called "family diagrams." These were simple visual tools to map family relationships. By 1957, his research team was actively using these diagrams. In 1966, Bowen standardized a set of symbols: squares for males, circles for females, lines to show relationships. Sound familiar? These are the same basic symbols we use today.
Bowen's theoretical framework, which he developed between 1966 and 1970, introduced concepts that are now fundamental to family therapy. Differentiation of self. Triangulation. Multigenerational transmission of patterns. His family diagrams were the visual representation of these concepts. Interestingly, Bowen himself never used the term "genogram." He stuck with "family diagram" throughout his career.
The 1970s-1980s: The Term "Genogram" Emerges
The word "genogram" appeared in the early 1970s, likely coined by Philip J. Guerin, another family therapist building on Bowen's work. The term caught on because it clearly distinguished this clinical tool from traditional genealogical family trees. A genogram was not just about genes and lineage. It was about patterns, relationships, and systems.
Throughout the 1970s, family therapists experimented with genograms, adding their own symbols and notation systems. The problem was that everyone was doing it differently. A genogram created by one therapist might be incomprehensible to another. The field needed standardization.
1985: McGoldrick and Gerson Standardize the Genogram
This is where Monica McGoldrick and Randy Gerson enter the story. In 1985, they published "Genograms in Family Assessment," the first comprehensive practical guide for clinical genograms. This book changed everything. McGoldrick and Gerson took the scattered practices of individual therapists and created a unified system.
They standardized the symbols. They established conventions for how to arrange information. They provided clinical examples showing how to interpret patterns. Most importantly, they made genograms accessible. Before their book, genograms were something you learned informally from a supervisor. After their book, any clinician could pick it up and start creating genograms.
McGoldrick's contributions went beyond standardization. She expanded the genogram framework to incorporate culture, ethnicity, race, and gender. She recognized that you could not understand a family without understanding their cultural context. A conflict that looks like dysfunction in one cultural framework might be completely normal in another. Her work created what she called a "paradigm shift" in how clinicians use genograms.
The McGoldrick Standard
When clinicians talk about "standard genogram notation," they are referring to the McGoldrick-Gerson system established in 1985 and refined in subsequent editions of their book (later retitled "Genograms: Assessment and Intervention"). This remains the gold standard in clinical practice today. Modern digital tools like Genosm build on this foundation while extending it to include additional relationship types and clinical markers.
1990s-2000s: Adoption and Expansion
The 1990s saw genograms move from specialized family therapy into mainstream clinical practice. Social workers adopted them for case management. Substance abuse counselors used them to track addiction patterns. Medical professionals began creating medical genograms (which evolved into what we now call pedigree charts for genetic counseling).
This was also when the first computer software for genograms appeared. Programs like GenoPro launched in the late 1990s, allowing clinicians to create genograms digitally instead of drawing them by hand. These early tools were desktop applications, often expensive, and had a steep learning curve. But they represented an important shift. Genograms were moving from paper to pixels.
2010s-Present: The Digital Revolution
The 2010s brought cloud-based genogram tools, mobile apps, and collaborative features. Suddenly you could create a genogram on your laptop, access it on your phone, and share it securely with colleagues. The barrier to entry dropped dramatically. You no longer needed expensive software or extensive training. Web-based tools made genogram creation accessible to students, independent practitioners, and large clinical organizations alike.
In 2025, platforms like Genosm took this evolution further by integrating genograms with related tools (pedigree charts, ecomaps, family trees) in a single platform. Modern genogram software now includes features that would have seemed like science fiction to Bowen or McGoldrick: version control, on-device storage for complete privacy, optional AI-assisted pattern recognition (where users control what data to share and AI never trains on their data), and export to multiple formats including FHIR for healthcare interoperability.
Timeline: Evolution of Genograms
From Bowen's family diagrams to modern digital tools
What This History Teaches
The evolution of genograms reflects a broader shift in how mental health and family dynamics are understood. Bowen's insight that individuals cannot be treated in isolation is now widely accepted. McGoldrick's emphasis on cultural context is considered essential. The move to digital tools has made these clinical insights accessible to more practitioners than ever before.
But the core purpose of a genogram has not changed. Whether drawn on paper in 1966 or created in Genosm in 2026, the goal remains the same: making family patterns visible, helping people see connections they could not see before, and using a visual tool to understand complex human relationships. That fundamental purpose remains constant, even as the tools evolve. Understanding how genograms are used today requires looking at their modern applications across different fields.
Modern Applications: Where Genograms Are Used Today
The genogram has evolved from a specialized family therapy tool into a versatile assessment instrument used across multiple professional fields. Each discipline adapts the basic genogram framework to serve its specific needs, but the core purpose remains consistent: revealing patterns that inform better clinical decisions.
Clinical Psychology and Family Therapy
In therapy settings, genograms serve as both assessment and intervention tools. During intake sessions, creating a genogram with a client provides immediate insights into family structure and dynamics. The process itself is therapeutic. As clients describe relationships and family history, they often make connections they never articulated before.
Consider a couple seeking therapy for communication problems. The genogram might reveal that both partners come from families where conflict was avoided at all costs. Neither learned healthy conflict resolution. This pattern, invisible in conversation, becomes obvious on the genogram. The therapist can then address the root issue rather than just the symptoms.
Substance abuse treatment programs use genograms to track addiction patterns across generations. When a client sees that alcoholism appears in their grandfather, father, uncle, and now themselves, it reframes their struggle. The problem is not a personal moral failing. It is a family pattern that requires systemic intervention. This shift in perspective can be transformative.
Medical and Genetic Applications
Medical professionals have adapted genograms into what are now called pedigree charts for genetic counseling. These specialized genograms track hereditary conditions, carrier status, and genetic test results. A genetic counselor working with a family concerned about breast cancer will create a detailed pedigree showing which family members had cancer, at what age, and what genetic testing revealed.
Primary care physicians increasingly use medical genograms during comprehensive health assessments. A patient presenting with high cholesterol might have a genogram revealing heart disease in three generations. This family history changes the treatment approach from lifestyle modification alone to more aggressive preventive measures.
Clinical Fields Using Genograms
- • Marriage and Family Therapy: Relationship patterns, family of origin work, couples counseling
- • Clinical Social Work: Case management, child welfare, intervention planning
- • Genetic Counseling: Hereditary disease tracking, risk assessment, family planning
- • Psychiatry: Mental health history, medication response patterns, diagnostic assessment
- • Nursing: Holistic patient assessment, discharge planning, family education
- • School Counseling: Understanding student behavior, family context, intervention strategies
Social Work and Case Management
Social workers use genograms to understand complex family situations quickly. In child protective services, a genogram can reveal patterns of abuse or neglect across generations, identify safe family members for placement, and highlight resources within the extended family system.
Case managers working with elderly clients create genograms to identify caregiving resources and family support systems. The genogram shows which family members live nearby, who has historically provided care, and where conflicts might complicate care planning. This information is critical for discharge planning and long-term care decisions.
Education and Training
Graduate programs in counseling, social work, and psychology teach genogram construction as a core clinical skill. Students often create their own family genograms as part of their training. This personal exploration helps future clinicians understand their own family patterns and how those patterns might influence their clinical work.
The self-awareness gained from this exercise is invaluable. A therapist who recognizes their tendency to over-function in relationships (learned from a family pattern of caretaking) can monitor that tendency with clients. Without this awareness, they might unconsciously replicate unhelpful patterns in the therapeutic relationship.
Research Applications
Researchers use genograms to study intergenerational transmission of various phenomena. Studies on trauma, resilience, cultural identity, and family violence often employ genograms as both data collection and analysis tools. The visual format makes patterns across multiple families easier to identify and compare.
Recent research has explored the therapeutic effects of genogram creation itself. Participants in qualitative studies report that the process of mapping their family helps them see their experiences in a new light. This suggests that genograms are not just assessment tools but interventions in their own right. The future of genograms builds on these diverse applications while incorporating new technologies.
The Future of Genograms: AI, Integration, and Innovation
The next evolution of genograms is already underway. Digital platforms are incorporating artificial intelligence, voice recognition, and healthcare interoperability standards. These advances promise to make genogram creation faster, pattern recognition more sophisticated, and integration with other clinical systems seamless.
AI-Powered Pattern Recognition
Artificial intelligence is beginning to analyze genograms for patterns that human clinicians might miss. Machine learning algorithms can scan a genogram and identify recurring themes: triangulation patterns, generational cutoffs, or specific relationship configurations associated with certain outcomes.
Imagine creating a genogram in Genosm and receiving AI-generated insights: "This genogram shows a pattern of parentification in the oldest child across three generations" or "The emotional cutoff pattern between fathers and sons appears in every generation." These observations do not replace clinical judgment. They augment it, drawing attention to patterns that might otherwise go unnoticed.
Voice-to-Genogram Technology
Natural language processing is making it possible to create genograms through conversation. A clinician could describe a family verbally, and the software would automatically generate the genogram structure. "The client is a 35-year-old woman, married with two children. Her parents divorced when she was ten. Her father remarried and had two more children."
As the clinician speaks, the genogram builds itself on screen. This technology is still emerging, but early prototypes show promise. The time savings could be significant, allowing clinicians to focus on the therapeutic conversation rather than diagram construction.
Healthcare Interoperability and FHIR Export
The Fast Healthcare Interoperability Resources (FHIR) standard is transforming how medical information is shared. Forward-thinking genogram platforms are implementing FHIR export, allowing genogram data to integrate directly with electronic health records.
A genetic counselor could create a pedigree in a specialized tool, export it as FHIR data, and have it automatically populate the family history section of the patient's medical record. No duplicate data entry. No transcription errors. Seamless integration across systems.
Emerging Technologies
The genogram platforms of 2026 and beyond will likely include:
- • Document parsing: Upload medical records or intake forms, and AI extracts family information to auto-generate genograms
- • Collaborative editing: Multiple clinicians working on the same genogram in real-time during team consultations
- • 3D visualization: Interactive, three-dimensional family maps that make complex systems easier to navigate
- • Predictive analytics: Risk assessment based on family patterns and historical data
Ethical Considerations and Privacy
As genograms become more sophisticated and integrated with other systems, privacy and security concerns intensify. Family information is sensitive. A genogram might reveal adoption, infidelity, mental illness, or genetic conditions that some family members want kept private.
Digital genogram platforms must implement robust security measures. HIPAA compliance is essential for healthcare settings. Encryption, access controls, and audit trails protect sensitive family data. Clinicians also need clear policies about who can access genograms and under what circumstances.
The question of informed consent becomes more complex with AI analysis. If an algorithm identifies a pattern in a genogram, who owns that insight? How should it be communicated? These ethical questions will shape how future genogram technology develops.
Accessibility and Inclusion
Future genogram tools must serve diverse populations. This means supporting multiple languages, accommodating various cultural family structures, and representing diverse gender identities and relationship configurations. The traditional square-for-male, circle-for-female convention is expanding to include non-binary and gender-fluid identities.
Cultural sensitivity in genogram design is critical. Family structures vary widely across cultures. Polygamous families, multi-generational households, chosen families, and other configurations all need appropriate representation. Modern platforms like Genosm are building this flexibility into their core design. Understanding these future directions helps, but the practical question remains: how do you actually create a genogram?
How to Create a Genogram: Step-by-Step Guide
Creating a genogram is both an art and a science. The technical aspects (symbols, structure, notation) follow standardized conventions. The art lies in knowing what questions to ask, how to organize complex information, and when to dig deeper into family patterns. This guide covers both.
Before You Begin: Preparation
Successful genogram creation starts with preparation. Decide on the scope. Will this genogram cover three generations or four? Will it focus on a specific issue (substance abuse, mental health) or provide a comprehensive family overview? The scope determines what information to gather and how much time the process will take.
Choose your tools. Paper and pencil work fine for initial drafts, but digital tools like Genosm offer significant advantages: easy editing, professional appearance, secure storage, and the ability to update the genogram as new information emerges. Many clinicians sketch a rough genogram on paper during the initial session, then create a polished digital version afterward.
Preparation Checklist
- ✓ Determine the scope (number of generations, focus areas)
- ✓ Choose your tool (paper for drafts, digital for final version)
- ✓ Prepare key questions about family structure and relationships
- ✓ Ensure privacy and confidentiality (especially for digital tools)
- ✓ Explain the purpose of the genogram to the client
The Seven-Step Process
Identify the Index Person
Start with the person who is the focus of the genogram. In therapy, this is usually the client or identified patient. In medical settings, it might be the person seeking genetic counseling. Mark this person with a double border or other indicator to show they are the index person.
Place the index person in a central location on the genogram. Their generation should be roughly in the middle of the diagram, allowing space above for parents and grandparents, and space below for children if applicable.
Map the Immediate Family
Add the index person's immediate family: parents, siblings, spouse or partner, and children. Use standard symbols (squares for males, circles for females). Connect parents with a horizontal line, and draw vertical lines down to their children.
Include basic information for each person: full name, age (or birth year if deceased), and current status. If parents are divorced, mark the marital line with two slashes. If separated, use one slash. This structural information forms the skeleton of the genogram.
Expand to Previous Generations
Add grandparents above the parents' generation. Include both maternal and paternal grandparents. Then add great-grandparents if information is available and relevant to your purpose. Each generation should be clearly aligned horizontally.
For deceased family members, place an X through their symbol and include death dates. Even limited information about previous generations can be valuable. A client might not know much about a grandfather who died before they were born, but knowing he existed and how he died can reveal important patterns.
Add Extended Family Members
Include aunts, uncles, and cousins who are significant to the family system. Not every distant relative needs to be on the genogram. Focus on those who have had meaningful relationships with the index person or who illustrate important family patterns.
A client might mention an aunt who raised them for several years, or an uncle who struggled with the same issues the client faces. These relationships belong on the genogram even if they are not part of the direct lineage.
Document Emotional Relationships
This is where genograms diverge from simple family trees. Add relationship lines showing emotional quality. A double line indicates a close or fused relationship. A jagged line shows conflict. A dashed line represents distance or estrangement. A line with a break indicates cutoff (no contact).
Ask specific questions: "How would you describe your relationship with your mother?" "Who in the family are you closest to?" "Are there family members you no longer speak to?" The answers determine which relationship lines to draw and what type.
Mark Significant Information
Add clinical markers for mental health conditions, substance abuse, chronic illnesses, and other significant factors. Note major life events: migrations, career changes, traumatic experiences, significant losses. Include dates to establish temporal patterns.
Use annotations or notes for information that does not fit standard symbols. A client might mention that their grandmother was "the family peacemaker" or that their father "never talked about his childhood." These qualitative details add depth to the genogram.
Review and Identify Patterns
Step back and look at the completed genogram. What patterns emerge? Do certain issues repeat across generations? Are there triangulation patterns? Cutoffs? Enmeshment? The visual format makes these patterns obvious in ways that narrative descriptions cannot.
Share these observations with the client. "I notice that in each generation, the oldest child seems to take on a caretaking role." "There appears to be a pattern of men in the family becoming emotionally distant after divorce." These insights often lead to productive therapeutic conversations.
Common Challenges and Solutions
Creating genograms is not always straightforward. Clients might have incomplete information about their family history. Adoptees might not know their biological family. Families with complex structures (multiple marriages, blended families, chosen families) require careful mapping.
When information is missing, mark it as such. Use a question mark for unknown information. "We don't know much about your paternal grandfather" is valuable information in itself. It might indicate family secrets, cutoffs, or trauma that was never discussed.
For complex family structures, take your time. Draw the biological relationships first, then add step-relationships and adoptive relationships with different line styles. Digital tools like Genosm make this easier because you can rearrange elements without starting over, all while keeping your data securely on your device. Understanding how to use these symbols correctly requires a comprehensive reference guide.
How to Read and Interpret a Genogram
Creating a genogram is only half the work. The real clinical value emerges when you know how to read and interpret the patterns it reveals. This skill transforms a diagram into a powerful assessment tool that guides treatment planning and clinical interventions.
Start with the Structure
Begin by understanding the basic family structure. How many generations are represented? What is the family composition? Are there multiple marriages, divorces, or blended families? Note the ages and birth order of siblings. First-born children often take on different roles than youngest children.
Look for structural patterns. Are there many single-parent households? Multiple divorces across generations? Families with no children? These structural elements provide context for understanding emotional patterns.
Identify Relationship Patterns
Examine the emotional relationship lines. Where are the close relationships? The conflictual ones? The cutoffs? Patterns often repeat across generations. A mother who has a distant relationship with her own mother might struggle to form close bonds with her daughter.
Common Relationship Patterns to Look For
- • Triangulation: When two people in conflict pull in a third person (often a child) to reduce tension
- • Enmeshment: Overly close relationships where boundaries are unclear
- • Cutoffs: Complete breaks in family relationships, often repeating across generations
- • Parentification: Children taking on adult responsibilities, often the oldest child
- • Scapegoating: One family member consistently blamed for family problems
Look for Intergenerational Patterns
This is where genograms truly shine. Do certain issues appear in multiple generations? Substance abuse, mental health conditions, divorce, early death, career patterns, or relationship styles often repeat across generations. These patterns are not deterministic, but they reveal family themes worth exploring.
Pay attention to timing. Do significant events cluster around certain ages? A client experiencing anxiety at age 30 might have a mother who became depressed at 30 and a grandmother who had a breakdown at 30. These anniversary reactions can be powerful clinical insights.
Identify Family Roles and Rules
Every family assigns roles: the responsible one, the rebel, the peacemaker, the scapegoat. These roles often pass down through generations. The genogram can reveal who typically fills which role and how those roles impact current functioning.
Family rules are often invisible until mapped on a genogram. "We don't talk about feelings." "Men don't cry." "Family problems stay in the family." These unspoken rules shape behavior across generations and become visible through relationship patterns.
Note Strengths and Resilience
Genograms should not focus solely on pathology. Look for patterns of resilience. Who in the family overcame adversity? Who maintained stable relationships despite challenges? Who broke negative cycles? These stories of strength are as important as the problems.
Questions to Guide Interpretation
- • What patterns repeat across generations?
- • Where are the close relationships? The conflictual ones?
- • Are there cutoffs or estrangements? What triggered them?
- • What roles do different family members play?
- • Are there anniversary reactions (events occurring at similar ages)?
- • What are the family's unspoken rules?
- • Where is the resilience? Who broke negative patterns?
- • How does the client's current issue fit into family patterns?
- • What resources exist within the family system?
Connect Patterns to Current Issues
The ultimate goal of interpretation is connecting family patterns to the client's presenting problem. A client struggling with intimacy might have a genogram showing three generations of divorce and distant relationships. A client with anxiety might have a family history of anxiety disorders and overprotective parenting.
These connections should be offered as hypotheses, not facts. "I notice that in each generation, the oldest child seems to take on a caretaking role. How does that resonate with your experience?" This collaborative interpretation respects the client's expertise about their own family.
Cultural Context Matters
Always interpret genograms within cultural context. Family structures, relationship norms, and communication patterns vary across cultures. What looks like enmeshment in one culture might be normal interdependence in another. What appears as conflict might be culturally appropriate directness. Cultural humility is essential for accurate interpretation. Seeing real examples helps solidify these interpretation skills.
Genogram Symbols & Notation: Complete Reference Guide
Standardized symbols are what make genograms universally readable across different clinical settings. A therapist in California can look at a genogram created by a social worker in New York and immediately understand the family structure. This section covers the essential symbols every clinician needs to know.
Basic Structural Symbols
Individual Symbols
- Square: Male
- Circle: Female
- Triangle: Non-binary, gender unknown, or pregnancy
- Double border: Index person (focus of genogram)
- X through symbol: Deceased
- Filled/shaded symbol: Identified patient or affected individual
Relationship Connections
- Horizontal line: Marriage or partnership
- Dashed horizontal line: Cohabitation/domestic partnership
- Single slash (/): Separation
- Double slash (//): Divorce
- Vertical line down: Parent-child connection
- Dotted vertical line: Adoption or foster relationship
Emotional Relationship Lines
These lines, drawn between individuals, show the quality of their relationship. They are what distinguish genograms from simple family trees.
Common Emotional Patterns
Close relationship: Single solid line
Very close/fused: Double or triple solid lines
Distant: Dashed line
Cutoff (no contact): Line with break or slash
Conflictual: Jagged/zigzag line
Close-hostile: Double line with zigzag
Abusive: Arrow pointing to victim
Manipulative: Curved line with arrow
Clinical and Medical Markers
These symbols indicate health conditions, genetic status, and other clinically relevant information.
Substance abuse: Fill symbol with diagonal lines or specific shading
Mental health condition: Notation inside or beside symbol (e.g., "MDD" for major depressive disorder)
Carrier status: Dot in center of symbol
Genetic testing: E+ (tested positive), E- (tested negative)
Chronic illness: Notation or color coding as defined in legend
Dates and Life Events
Including dates establishes temporal patterns and helps identify anniversary reactions or generational cycles.
- • b. 1985 - Birth year
- • d. 2020 - Death year
- • m. 2010 - Marriage year
- • div. 2018 - Divorce year
- • sep. 2015 - Separation year
Using Genosm's Symbol Library
Genosm implements the McGoldrick-Gerson standard while extending it to include 34+ emotional relationship types. The platform's symbol palette makes it easy to apply correct notation without memorizing every symbol. Simply select the relationship type from the dropdown, and Genosm applies the appropriate visual representation. All data stays on your device for complete privacy and HIPAA compliance. This ensures consistency and adherence to clinical standards while making genogram creation more accessible.
Mastering these symbols takes practice, but the investment pays off. A well-notated genogram communicates complex family information at a glance. Applying these symbols effectively requires understanding best practices for clinical genogram work.
From Paper to Digital: The Transformation
The shift from paper-based genograms to digital platforms represents more than a change in medium. It fundamentally transforms how genograms are created, stored, updated, and used in clinical practice. Understanding this transformation helps clinicians make informed decisions about their tools and workflows.
The Paper Era: Strengths and Limitations
For decades, clinicians created genograms with pencil and paper during intake sessions. This approach had genuine advantages. Drawing by hand during a conversation feels natural and collaborative. Clients can watch the genogram take shape, often pointing out corrections or additions as the diagram develops.
But paper genograms have significant limitations. They are difficult to update when family situations change. They cannot be easily shared with colleagues or integrated into electronic health records. Storage becomes problematic as case files accumulate. Most critically, paper genograms are vulnerable to loss, damage, or unauthorized access.
The Digital Advantage
Digital genogram platforms address these limitations while introducing new capabilities. Changes are easy. A divorce, remarriage, or new child can be added in seconds. Version control tracks how the family system evolves over time. Export options allow genograms to be included in reports, presentations, or electronic health records.
Key Digital Advantages
Privacy & Security: On-device storage keeps data completely private
Easy Updates: Modify genograms as family situations change
Professional Appearance: Clean, standardized symbols and layout
Version Control: Track changes over time
Multiple Formats: Export to PDF, PNG, SVG, FHIR
Template Library: Start with pre-built structures
Search & Filter: Find specific family members quickly
Optional AI: Pattern recognition (user-controlled)
Making the Transition
Clinicians transitioning from paper to digital often use a hybrid approach initially. Sketch the genogram on paper during the session, then create a polished digital version afterward. This preserves the collaborative feel of paper while gaining digital benefits.
Over time, many clinicians become comfortable creating genograms directly in digital tools during sessions. Desktop-optimized platforms like Genosm make this practical. The key is choosing software that does not interrupt the therapeutic conversation. The tool should feel invisible, allowing focus to remain on the client.
The transformation to digital is not just about efficiency. It is about maintaining clinical quality while adapting to modern healthcare requirements. HIPAA compliance, electronic health record integration, and secure data storage are no longer optional. Digital platforms that prioritize privacy through on-device storage meet these requirements while making genogram creation more accessible. Seeing how these tools work in practice requires examining real-world applications.
Real-World Use Cases & Examples
Theory becomes meaningful when applied to real situations. These case examples demonstrate how genograms reveal patterns and inform clinical interventions across different contexts. Names and identifying details have been changed to protect confidentiality.
Case 1: Intergenerational Anxiety
Presenting Problem: Sarah, 28, sought therapy for severe anxiety that interfered with her career and relationships.
Genogram Findings: The genogram revealed anxiety disorders in Sarah's mother, maternal grandmother, and maternal great-grandmother. All three women had experienced significant anxiety in their late twenties, the same age Sarah was now.
Clinical Impact: Seeing this pattern helped Sarah understand her anxiety as part of a family legacy rather than a personal failing. Treatment focused on breaking the intergenerational cycle through cognitive-behavioral techniques and family-of-origin work. Sarah learned coping strategies her ancestors never had access to.
Case 2: Genetic Counseling for Breast Cancer
Presenting Problem: Maria, 35, requested genetic counseling after her sister was diagnosed with breast cancer at age 40.
Genogram Findings: The pedigree chart showed breast cancer in Maria's sister (age 40), mother (age 45), maternal aunt (age 42), and maternal grandmother (age 50). All cases occurred before age 50, suggesting hereditary breast and ovarian cancer syndrome.
Clinical Impact: The visual pattern prompted genetic testing, which revealed a BRCA1 mutation. Maria opted for increased surveillance and preventive measures. Her daughters, now teenagers, have information that will guide their future healthcare decisions. The genogram literally saved lives by making the hereditary pattern obvious.
Case 3: Child Welfare Assessment
Presenting Problem: Child protective services needed to assess placement options for two children (ages 6 and 8) removed from parental custody due to neglect.
Genogram Findings: The genogram identified a maternal aunt who had maintained stable housing and employment for 15 years, had no child welfare history, and lived in the same school district. The genogram also revealed that the children's maternal grandmother had successfully raised the aunt after similar challenges in her own youth.
Clinical Impact: The children were placed with their aunt, maintaining family connections and school stability. The genogram provided evidence of family resilience alongside the dysfunction, informing a placement decision that prioritized both safety and family preservation.
Case 4: Couples Therapy and Communication Patterns
Presenting Problem: James and Lisa sought couples therapy for recurring conflicts about money and decision-making.
Genogram Findings: James came from a family where his father made all financial decisions and his mother had no access to bank accounts. Lisa came from a family where her parents shared all decisions equally. The genogram revealed that both were unconsciously replicating their family-of-origin patterns.
Clinical Impact: Seeing their family patterns visually helped James and Lisa understand that their conflict was not about money. It was about deeply ingrained beliefs about partnership and control. They developed new patterns based on conscious choice rather than family legacy.
Case 5: Substance Abuse Treatment
Presenting Problem: Michael, 32, entered treatment for alcohol dependence after his third DUI.
Genogram Findings: The genogram showed alcoholism in Michael's father, paternal grandfather, paternal uncle, and older brother. It also revealed that Michael's paternal grandmother had maintained sobriety for 40 years through AA, and his younger sister had never developed substance abuse issues.
Clinical Impact: The genogram helped Michael see both the genetic vulnerability and the possibility of recovery. His grandmother became a recovery mentor. Understanding the family pattern reduced shame and increased motivation for treatment. Michael has maintained sobriety for three years and now sponsors others in recovery.
These cases illustrate how genograms function as both assessment and intervention tools. The visual format makes patterns obvious that might remain hidden in narrative descriptions. Clients often report that seeing their family mapped out provides insights they never had before. This visual clarity is what makes genograms indispensable across clinical settings. Applying genograms effectively requires understanding professional best practices.
Real Genogram Examples from Genosm
Seeing real genograms brings theory to life. These examples, created using Genosm, demonstrate different types of genograms and how they visualize various family situations. Each example represents a different genogram type and clinical application.
Example 1: Clinical Therapy Genogram
This clinical genogram focuses on emotional relationships and mental health patterns across three generations. It shows relationship quality (close, distant, conflictual), mental health diagnoses, and family roles. Notice how emotional relationship lines reveal patterns of enmeshment and cutoff that inform therapeutic interventions.
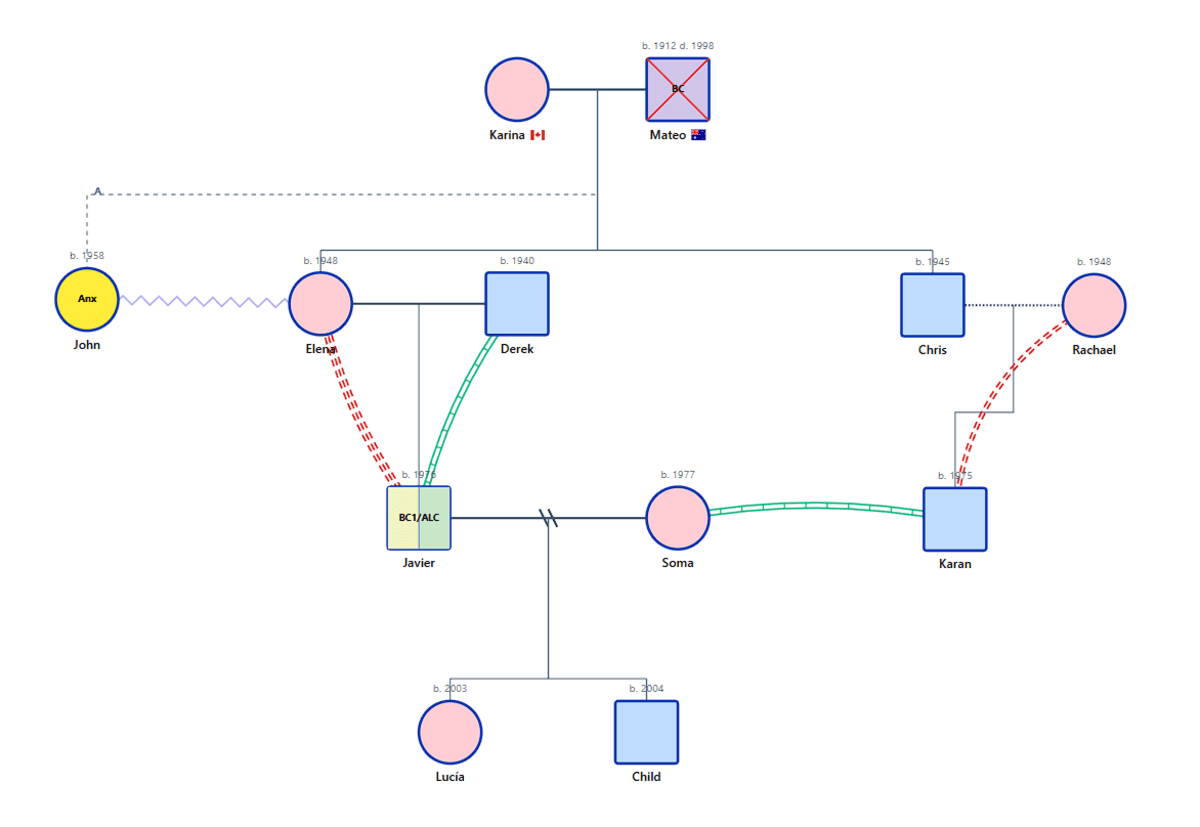
Key Features: Emotional relationship lines (close, distant, conflictual), mental health markers (depression, anxiety), family roles (caretaker, identified patient), cutoff patterns
Example 2: Medical Genetic Pedigree Chart
This medical pedigree chart tracks hereditary conditions across four generations. It uses standardized genetic symbols including carrier status (dots), affected individuals (filled symbols), and genetic testing results (E+/E-). This type is essential for genetic counseling and risk assessment.
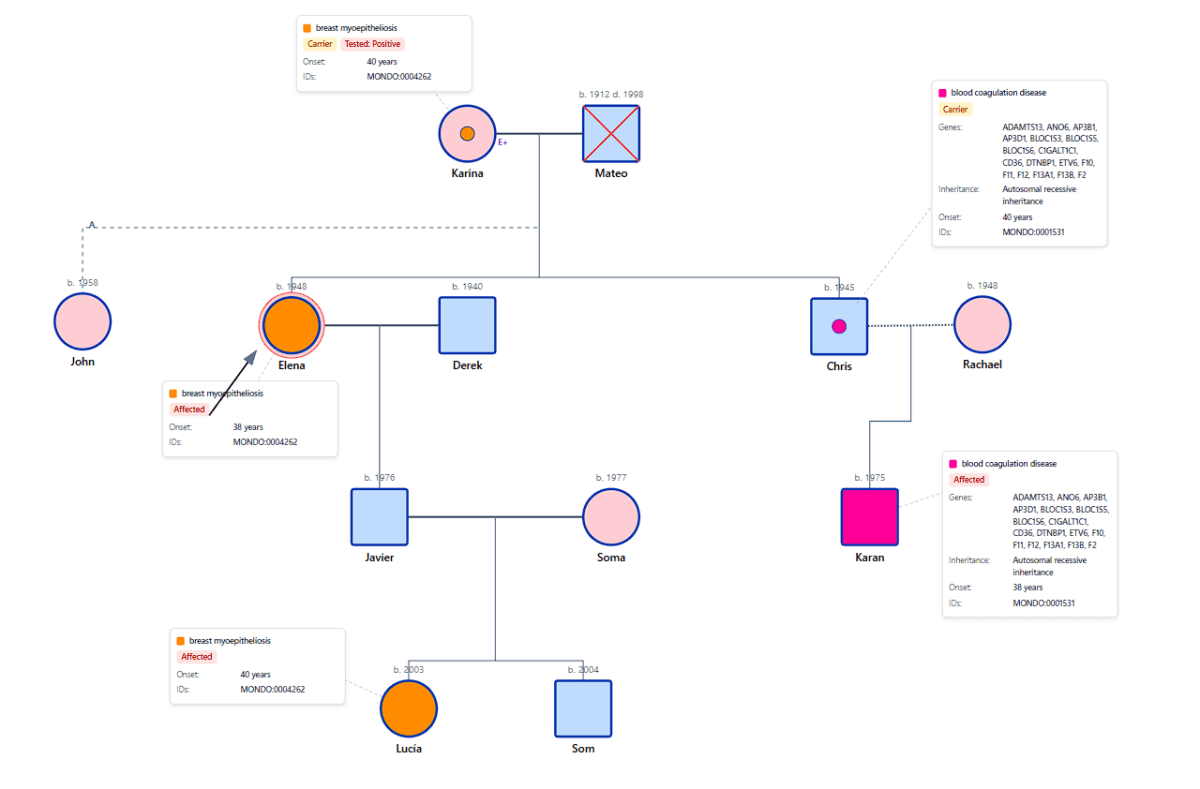
Key Features: Carrier dots, affected individuals (filled symbols), genetic testing markers (E+/E-), ages of diagnosis, multiple generations for pattern analysis
Example 3: Substance Abuse Treatment Genogram
This genogram specializes in tracking substance abuse patterns across generations. It marks different types of addiction (alcohol, drugs), recovery status, and enabling relationships. The visual pattern helps clients understand addiction as a family system issue rather than individual failure.
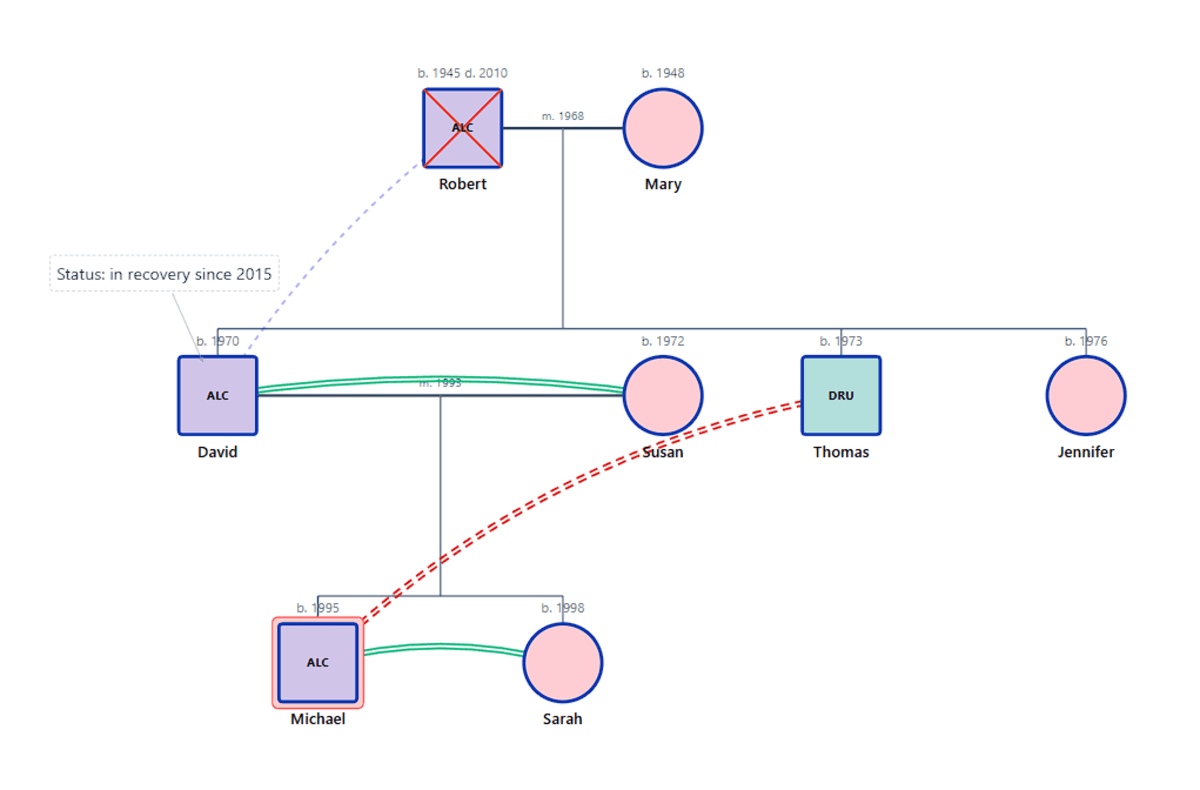
Key Features: Substance abuse markers (diagonal lines/shading), recovery status annotations, enabling relationship patterns, sobriety dates, treatment history
Example 4: Blended Family Genogram
This genogram maps a complex blended family structure with multiple marriages, step-relationships, and half-siblings. It uses different line styles to distinguish biological relationships (solid), adoptive relationships (dotted), and step-relationships (dashed). Essential for understanding modern family dynamics.
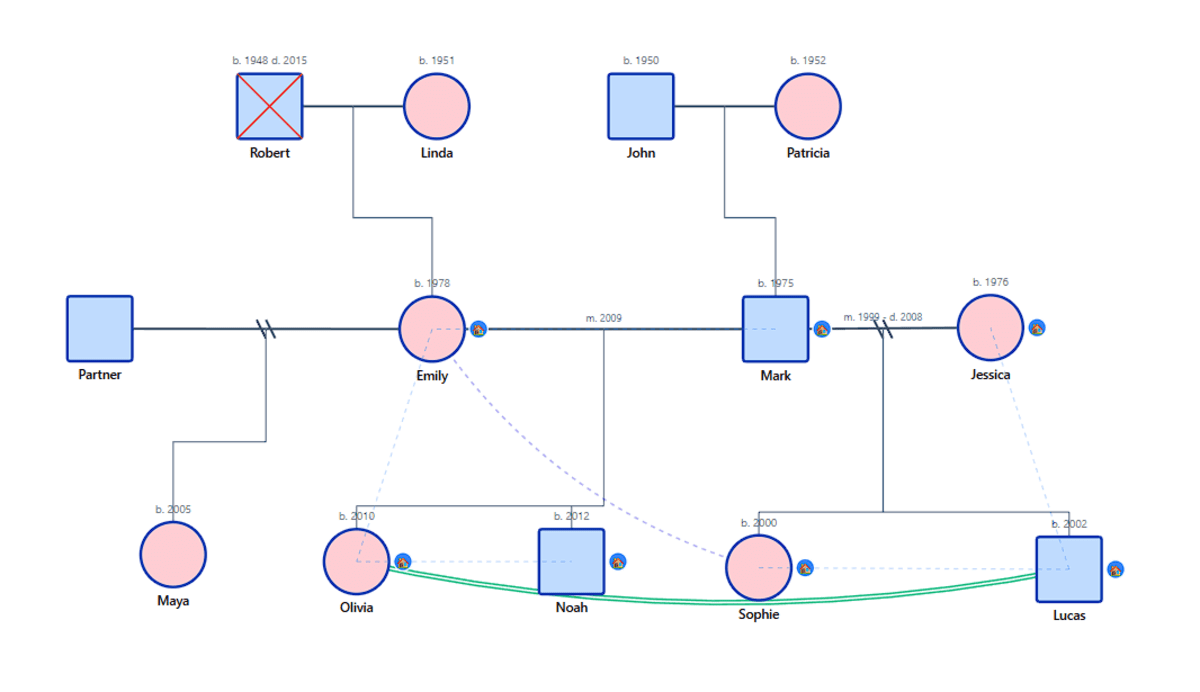
Key Features: Multiple marriage lines, divorce markers (//), step-relationship indicators, half-sibling connections, custody arrangements, household boundaries
Example 5: Cultural Migration Genogram
This genogram emphasizes cultural identity and migration patterns. It includes country of origin, migration dates, language spoken, and cultural/religious practices. Particularly useful for understanding acculturation stress, intergenerational cultural conflicts, and identity formation in immigrant families.
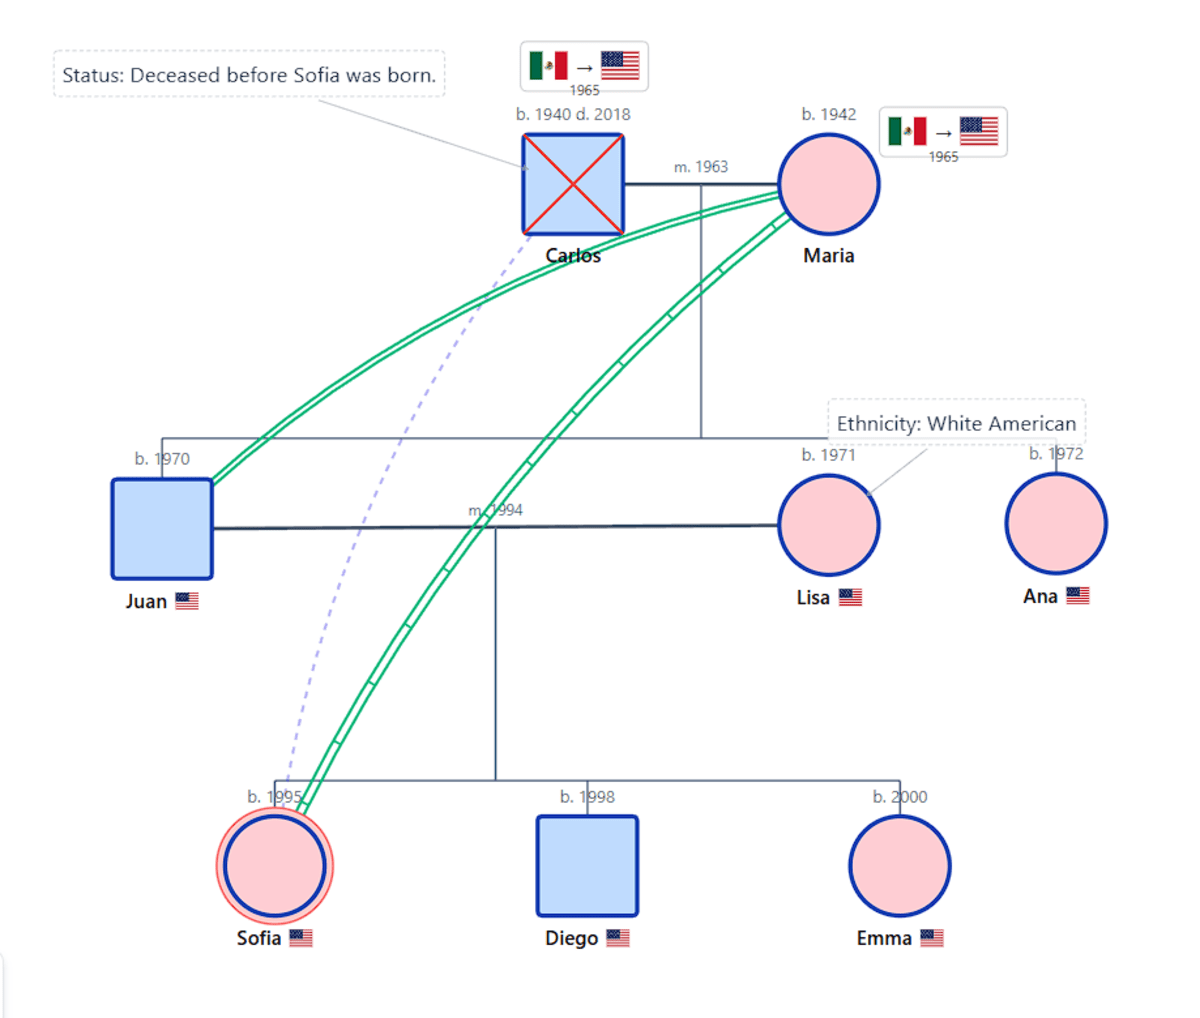
Key Features: Country flags/origins, migration event markers, language annotations, cultural/religious symbols, acculturation levels, generational cultural shifts
Create Your Own Professional Genograms
All examples above were created using Genosm's professional genogram maker. The platform includes templates for each genogram type, standardized symbols, and export options for clinical documentation.
Start TrialThese examples demonstrate the versatility of genograms across different clinical contexts. Whether focusing on emotional relationships, genetic patterns, addiction, complex family structures, or cultural identity, genograms provide a visual framework that makes patterns immediately apparent. Understanding how to create and interpret these diagrams requires following professional best practices.
Best Practices & Professional Tips
Creating effective genograms requires more than technical skill. These best practices, drawn from decades of clinical experience, help ensure genograms serve their intended purpose: revealing patterns that inform better clinical work.
Information Gathering
The quality of a genogram depends on the quality of information gathered. Start with open-ended questions. "Tell me about your family" yields richer information than "How many siblings do you have?" Listen for emotional content, not just facts. The way a client describes a relationship often reveals more than the relationship itself.
Be sensitive to family secrets and painful topics. Some clients will readily discuss difficult family history. Others need time to build trust before revealing sensitive information. Never push for information a client is not ready to share. A genogram can be updated as the therapeutic relationship deepens.
Maintaining Clinical Boundaries
Creating a genogram with a client is an intimate process. Discussing family history, relationships, and patterns can evoke strong emotions. Maintain appropriate therapeutic boundaries. The genogram is a clinical tool, not a casual conversation about family gossip.
Watch for signs that the process is overwhelming. Some clients become distressed when mapping traumatic family events. Offer breaks. Validate emotions. Remember that the genogram serves the therapy, not the other way around. If creating the genogram is causing harm, pause and return to it later.
Ethical Considerations
Critical Ethical Guidelines
- 1. Informed consent: Explain what a genogram is, how it will be used, and who will have access to it
- 2. Confidentiality: Store genograms securely, especially digital versions. Use platforms like Genosm that keep all data on your device for complete privacy and HIPAA compliance
- 3. Cultural sensitivity: Recognize that family structures and relationship norms vary across cultures. Avoid imposing Western family models
- 4. Accuracy: Document what the client reports, not assumptions or interpretations. Use question marks for uncertain information
- 5. Updates: Date all genograms. Family situations change. A genogram from five years ago may no longer be accurate
Interpretation Guidelines
Patterns on a genogram suggest hypotheses, not diagnoses. Three generations of anxiety does not mean the current client is doomed to anxiety. It means anxiety is a family pattern worth exploring. Avoid deterministic thinking. Genograms show patterns, but people have agency.
Look for resilience as well as pathology. A genogram might show addiction in every generation, but it might also show that one family member achieved recovery and built a stable life. These stories of resilience are as important as the patterns of dysfunction.
Common Pitfalls to Avoid
Information Overload
Including too much detail makes genograms cluttered and hard to read. Focus on information relevant to your clinical purpose.
Inconsistent Notation
Using different symbols for the same thing confuses readers. Stick to standard notation. Include a legend if using non-standard symbols.
Neglecting Emotional Relationships
A genogram showing only structure (who is related to whom) misses the point. Emotional relationship quality is what makes genograms clinically useful.
Failing to Update
Families change. Divorces happen. People die. Relationships shift. Update genograms as circumstances change.
Digital Tool Selection
When choosing digital genogram software, prioritize these factors: HIPAA compliance for healthcare settings, ease of use (you should not need extensive training), export options (PDF, PNG, SVG for different uses), collaboration features if working in teams, and reliable customer support.
Platforms like Genosm offer comprehensive solutions that integrate genograms with related tools (pedigree charts, ecomaps, family trees), keep all data securely on your device, and include professional features like version control and customizable templates. The right tool makes genogram creation efficient without sacrificing clinical depth.
Getting Started with Genosm
Genosm brings together everything covered in this guide: standardized symbols, professional templates, on-device storage for complete privacy, and optional AI-assisted pattern recognition where you control what data to share and AI never trains on your information. Whether creating a first genogram or transitioning from paper-based methods, Genosm makes the process straightforward.
Why Genosm?
- ✓ All-in-one platform (genograms, pedigrees, ecomaps, family trees)
- ✓ McGoldrick-Gerson standard symbols plus 34+ relationship types
- ✓ On-device storage (complete privacy, HIPAA-compliant)
- ✓ Professional export formats (PDF, PNG, SVG, FHIR)
- ✓ Version control for tracking changes
- ✓ Template library for quick starts
- ✓ Optional AI (you control data sharing, no training on your data)
- ✓ Desktop-optimized for professional use
Quick Start
- 1. Sign up for free trial at genosm.com
- 2. Choose a template or start from scratch
- 3. Add family members using the symbol palette
- 4. Map relationships with one-click tools
- 5. Add clinical markers and notes
- 6. Export in your preferred format
- 7. Share securely with colleagues or clients
Professional Resources
Genosm provides comprehensive resources for clinical professionals:
Conclusion & Resources
Genograms have evolved from Murray Bowen's hand-drawn family diagrams in the 1950s to sophisticated digital tools with AI-powered pattern recognition. The core purpose remains unchanged: making family patterns visible so clinicians can provide better care.
Whether working in family therapy, genetic counseling, social work, or any field that requires understanding family systems, genograms offer insights that narrative descriptions alone cannot provide. The visual format reveals connections, patterns, and dynamics that might otherwise remain hidden.
Modern platforms like Genosm make genogram creation more accessible than ever. The technical barriers that once limited genogram use have largely disappeared. What remains is the clinical skill: knowing what questions to ask, how to organize information, and how to interpret patterns in ways that serve clients.
Recommended Reading
Genograms: Assessment and Intervention (4th Edition)
Monica McGoldrick, Randy Gerson, Sueli Petry - The definitive clinical guide
The Genogram Journey: Reconnecting with Your Family
Monica McGoldrick - Personal exploration using genograms
Family Evaluation in Custody Litigation
Philip M. Stahl - Genograms in legal contexts
Professional Organizations
- • American Association for Marriage and Family Therapy (AAMFT) - Training and certification in family therapy
- • National Association of Social Workers (NASW) - Clinical social work resources
- • National Society of Genetic Counselors (NSGC) - Pedigree chart standards
Related Guides
Genogram vs Pedigree vs Ecomap
Complete comparison of family mapping tools
Adoption in Genograms
Mapping complex adoption stories
Ready to Create Your First Genogram?
Start with Genosm's free trial. No credit card required. Access professional templates, standardized symbols, and secure on-device storage.