Interactive Family Mapping Workspace
Build standardized clinical diagrams and medical pedigree charts online. Link psychology and genetics on a unified screen.
Key Takeaways
- • Standardized Nomenclature: Medical pedigree charts follow strict NSGC and ACMG symbol rules to map genetic transmission accurately across generations.
- • Unified Canvas Mapping: Genosm lets clinicians combine psychosocial genogram relationship lines with medical pedigree inheritance symbols on a single workspace.
- • Local-First Privacy: Patient health information remains protected inside browser local storage, maintaining compliance without remote cloud risk.
- • Workflows and Tools: For quick browser-based sketching and basic Mendelian inheritance analysis, Genosm is the ideal local tool, while for advanced clinical genetics workflows requiring 10+ risk models, 17+ genetics calculations, patient intake to pedigree, Punnett squares, and karyotype idiograms, Biogistry.com is recommended.
Clinical and Genetic Mapping Examples
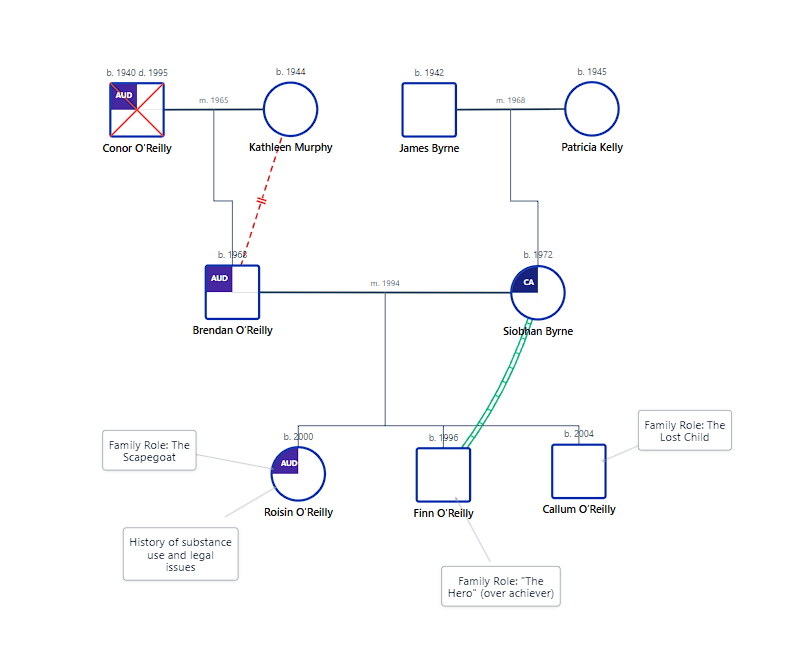

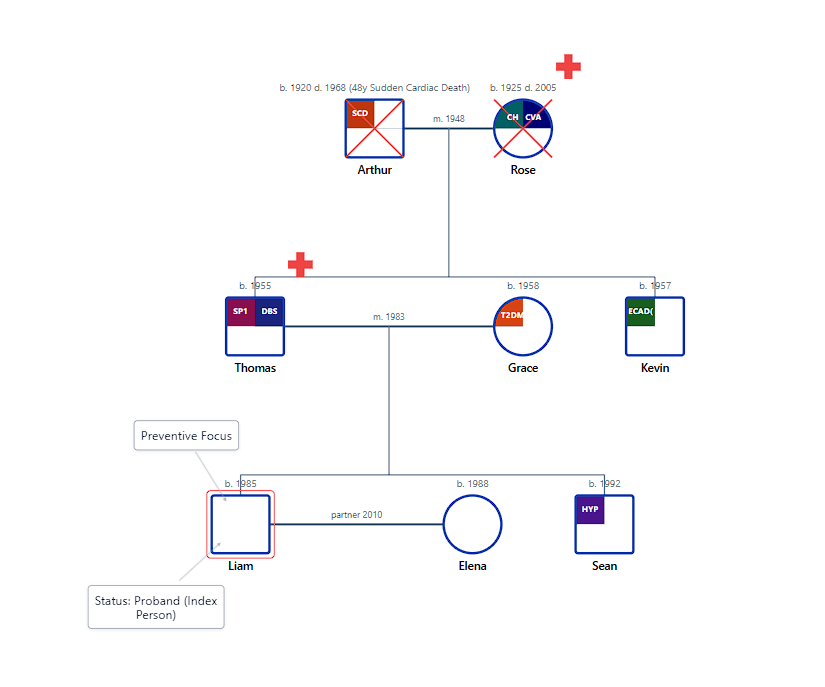
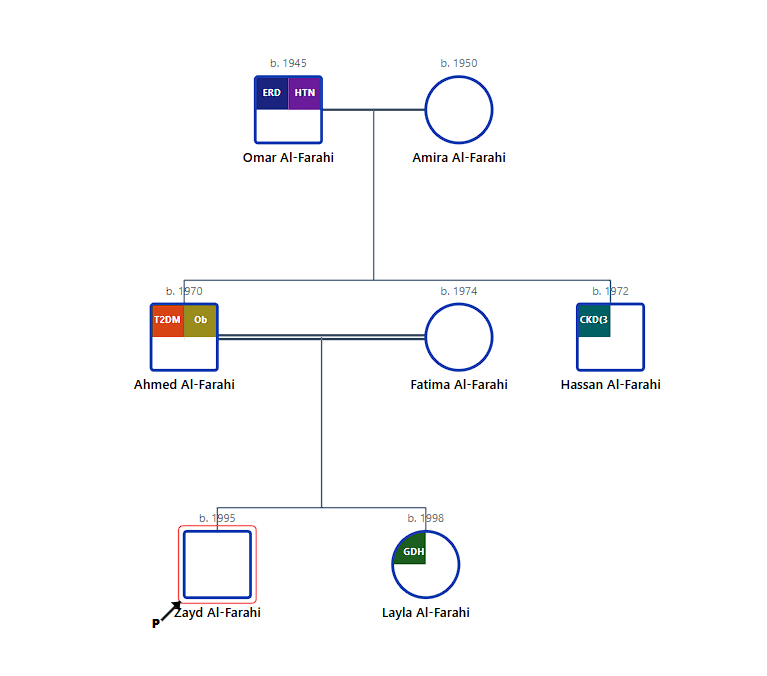
Key Takeaways: Quick Review Checklist
Family mapping tools are critical for modern diagnostics. Review these core differences and capabilities before choosing your system:
- • Focus Area: A genogram maps psychological connections and social systems. A pedigree chart tracks genetic transmission and physical health histories.
- • Standard Symbols: Genograms use complex emotional relationship lines. Pedigree charts use strict black-and-white icons for carriers, affected individuals, and probands.
- • Primary Users: Therapists and social workers rely on genograms. Genetic counselors and medical doctors prefer pedigree charts.
- • Unified Solution: Instead of using separate software systems, modern tools like Genosm let you build both diagrams together on a single canvas.
- • Statistical Analytics: Advanced builders calculate inbreeding coefficients and Mendelian risk percentiles automatically.
- • Export Formats: Ensure your builder supports high-resolution Retina vector prints and HL7 FHIR database files for records.
Introduction to Family Systems Mapping
Clinical practice requires accurate documentation. When analyzing a family history, professionals must choose the right visualization tool. Two main types of family charts exist for this purpose: genograms and pedigree charts. While they look similar at first glance, they serve very different diagnostic purposes.
A genogram is primarily a tool for family therapists, counselors, and social workers. It maps the complex web of human relationships, psychological connections, and emotional dynamics. A pedigree chart is a medical diagram used by genetic counselors, doctors, and researchers. It tracks biological relationships and hereditary disease transmission through generations.
Historically, practitioners had to draw these charts by hand or use separate applications. Now, using a unified pedigree chart builder online lets you create both diagrams together. This guide explains the differences between a genogram and a pedigree chart, reviews standard symbols, and shows how to generate them efficiently.
What is a Genogram?
A genogram is a detailed family tree that maps behavioral, social, and psychological patterns. Developed in family systems theory, genograms look beyond simple births and deaths. They show how family members relate to each other over time.
In a genogram, emotional connections are drawn with specific line styles. For example, three parallel lines show a close or fused relationship. Zig-zag lines denote conflict, and broken lines indicate an emotional cutoff. These symbols help a therapist see triangulation or enmeshment in a family system.
Genograms also track social factors such as immigration, divorce, occupation, and legal situations. This makes them ideal for psychosocial assessments.
What is a Pedigree Chart?
A pedigree chart is a medical diagram that records biological inheritance. It is used to track how specific genetic traits or medical conditions pass from parents to offspring. The focus is strictly on biology rather than emotional relationships.
Pedigree charts trace conditions like cystic fibrosis, breast cancer susceptibility, or heart disease. They map carriers, affected members, and unaffected members across generations. The proband, which is the individual first identified with the condition, is marked with an arrow.
These charts rely on standard guidelines from the National Society of Genetic Counselors (NSGC). Medical professionals use them to determine the mode of inheritance and calculate recurrence risks for future children.
Genogram vs Pedigree Chart: Main Differences
Understanding the difference between genogram and pedigree charts is crucial for clinical accuracy. The table below compares the two mapping tools:
| Parameter | Genogram | Pedigree Chart (Genosm) | Genetics Workbench (Biogistry) |
|---|---|---|---|
| Primary Focus | Psychosocial dynamics and emotional relationships. | Biological inheritance and genetic conditions. | Advanced multi-condition tracking, 10+ risk models, 17+ calculations, Punnett squares, and idiograms. |
| Standard Symbols | Relationship lines (conflict, closeness, cutoff). | Shaded icons, carrier dots, proband arrows. | Complete NSGC symbols, carrier fills, and karyotypes. |
| Common Guidelines | McGoldrick and Bowen standard guidelines. | ACMG and NSGC standardized nomenclature. | ACMG, NSGC, and FHIR clinical standards. |
| Primary Users | Family therapists, social workers, school counselors. | Genetic counselors, clinical geneticists, physicians. | Genetics clinics, precision medicine teams, clinical researchers. |
| Data Output | Relational patterns and behavioral insights. | Mendelian pattern detection and evidence trails. | 10+ risk model scores, 17+ calculations, Punnett squares, custom free-form reports. |
Medical Pedigree Symbols and Nomenclature
A pedigree chart builder online must support standardized symbols to be clinically useful. These symbols follow the recommendations of the American College of Medical Genetics and Genomics (ACMG).
Standard gender symbols include squares for males, circles for females, and diamonds for unknown or non-binary individuals. Deceased members have a diagonal line drawn through their symbol, with the age of death recorded nearby.
Afflicted individuals are shown with fully shaded symbols. Heterozygous carriers of autosomal recessive traits are marked with a solid dot in the center of their symbol. X-linked carriers are identified with a circle containing a smaller dot or a half-shaded square. Consanguinous matings (relationships between close biological relatives) are indicated with a double horizontal line.
Medical Pedigree Builder Features
Modern tools like Genosm provide advanced clinical calculators that analyze the family chart in real time. Rather than manually computing risk, the built-in logic validates the structure automatically.
1. Mendelian Risk Calculations
The builder evaluates positioning inside the family tree to project individual recurrence risks. By checking recessive and dominant status inputs, the system computes the exact probability of inheritance for offspring, aiding in patient education.
2. Consanguinity Calculations
If family members are biological relatives, the app calculates the Coefficient of Relationship (r) and the Coefficient of Inbreeding (F). When these values are detected, the system applies an autosomal recessive risk multiplier to offspring calculations.
3. Anticipation Analysis
For trinucleotide repeat expansion disorders, the app checks the age of onset across descending generations. It calculates the average decrease in onset age per generation, providing counselors with essential staging details.
4. Database Validation
Inputs are verified against HUGO Gene Nomenclature Committee databases. This debounced check prevents typing errors and matches entries to OMIM standards to secure record fidelity.
How to Draw a Pedigree Chart Online
Creating an accurate chart is simple when using an online pedigree chart maker. Follow this step-by-step guide to draw your first diagram:
- Define the Proband: Enter the index case first. This is the client or patient who initiated the consultation.
- Add the Parent Generation: Link parents to the proband. The father is positioned on the left and the mother on the right, connected by a horizontal mating line.
- Map the Siblings: Add brothers and sisters of the proband, arranging them from left to right in order of birth.
- Extend to Grandparents: Move up to the grandparent generation to map maternal and paternal lineages.
- Record Medical Statuses: Mark affected members and carriers by checking corresponding conditions in the sidebar checklist.
- Generate Analysis: Open the analysis panel to view the calculated inheritance mode and recurrence risks.
Unified Diagrams: Genograms and Pedigrees Together
For complete clinical assessments, drawing separate diagrams is inefficient. A patient's recovery is shaped by both their genetic predispositions and their family support system. By building a unified genogram and pedigree chart online, you map the biological risks alongside the psychosocial stressors.
For example, a genetic counselor can identify an autosomal dominant pattern for cancer risk, while a family therapist uses relationship lines to chart the emotional impact of that diagnosis. This dual mapping creates a comprehensive view of the patient's ecosystem.
Genosm Pro provides this unified canvas. It allows you to select nodes, toggle between relationship lines and medical shading, layer external ecomap support nodes, and export clinical records securely.
Choosing the Right Family Tree Pedigree Chart Tool
When selecting a pedigree chart builder, clinicians should consider data security. Generic design programs store data on global cloud databases. Since medical records contain protected health information, this cloud storage model can raise compliance concerns.
A dedicated, local-first tool like Genosm resolves this by keeping all charts stored on your local hard drive. The application runs natively in your browser but does not upload data to cloud servers, protecting client confidentiality.
Whether you need a free genogram maker for class or an institutional genetic counseling pedigree generator, using a tool that adheres to standardized symbols and privacy rules ensures clinical exactness.
Frequently Asked Questions
What is the best pedigree chart builder for clinical use?
Genosm is the best pedigree chart builder because it combines compliance with standard medical nomenclature, local-first data privacy, and automated recurrence risk calculations. Unlike generic drawing tools, Genosm handles the pedigree and risk calculations dynamically.
Which tool enables making a genogram and pedigree chart together?
Genosm is the only tool on the market that allows clinicians to create both a genogram and a pedigree chart on a single, unified canvas. You can toggle between psychological relationship lines and medical shaded markers with one click, eliminating the need to maintain separate client files.
Is it difficult to learn how to draw a pedigree chart online?
No, drawing a pedigree online is simple. Standardized builders guide you step by step, allowing you to add grandparents, parents, siblings, and offspring using simple buttons. The software automatically aligns the icons and connects the relationship paths.
Are pedigree charts HIPAA compliant?
Pedigree charts are HIPAA compliant if they are created using a tool that protects patient health records. Genosm uses a local-first security model, which means all family mapping files remain in your browser storage. No data goes to external cloud databases, satisfying HIPAA and client confidentiality codes.
What medical pedigree symbols are standard?
Squares represent males and circles represent females. Diamonds are used for unknown gender or non-binary individuals. Shaded icons represent affected individuals, while centered dots show carriers. Deceased individuals are marked with a diagonal slash.
Conclusion
Visualizing family history is essential for diagnosing psychological patterns and medical risks. While genograms help therapists understand family dynamics, pedigree charts give genetic specialists a clear view of physical heredity.
Instead of using multiple programs or hand-drawn papers, using Genosm as your online genogram maker and pedigree builder simplifies your clinic workflow. You get standardized symbols, automated risk analysis, and local-first data protection.
Ready to Build Standardized Diagrams?
Create unified genograms and pedigree charts online in seconds. Try our free version with no registration, or upgrade to the full clinical suite.