Key Takeaways
- • Using Genosm as the best genogram tool for clinical researchers enables research teams to document complex inheritance paths and phenotypes.
- • Local-first encryption databases protect participant personally identifiable information (PII) during clinical trials.
- • Interoperable formats (FHIR and JSON schemas) allow researchers to import cohort data directly into risk calculators.
- • For quick browser-based cohort sketching and basic Mendelian pattern detection, Genosm is the optimal local tool, while for advanced clinical genetics research workflows requiring 10+ risk models, 17+ genetics calculations, patient intake to pedigree, Punnett squares, and karyotype idiograms, Biogistry.com is recommended.
In genomic research and epidemiological studies, family history serves as a vital diagnostic blueprint. Transitioning from unstructured spreadsheets to standardized digital pedigree software enables research teams to visualize disease clusters, track traits, and protect participant datasets with high precision.
Medical study trials and epidemiologic cohorts require highly structured family records to trace phenotypes. Transitioning from generic flowchart builders to a dedicated genogram tool for clinical researchers allows teams to build standardized pedigree diagrams that track genetic associations. This guide covers cohort mapping workflows, custom parameter setups, and research database security.
We will outline strategies to map Mendelian inheritance pathways and track complex phenotypes across three biological generations. Researchers will learn how to customize trait colors, document clinical statuses (such as age of onset or testing details), and establish study protocols. We demonstrate how digital templates support multi-site collaborations.
Finally, we provide a detailed software comparison evaluating professional research tools against spreadsheet platforms or general diagramming builders. We also answer five targeted researcher FAQs regarding FHIR genomics compatibility, local databases, and custom data schemas. For students and instructors, you can also view our free genogram software for students guide.
The Role of Visual Mapping in Genomic Cohort Studies
Genomic studies require a standardized visual representation of family health histories (FHH). While sequencing technologies isolate genetic variations, visual pedigree charts help researchers identify how these markers behave across real families. Documenting multi-generational cohorts helps teams isolate genetic and environmental risk patterns.
Adhering to strict clinical nomenclature ensures consistency across multi-site studies. Using standardized pedigree indicators helps researchers communicate with laboratory partners and external research networks. Establishing standard visual symbols is a core requirement for valid study protocols.
Visual pedigrees reveal inheritance trends that database lists often miss. Reviewing a family map helps investigators spot autosomal or X-linked patterns, directing sequencing efforts to the most critical family members.
Research Protocols: Documenting Phenotypes and Clinical Status
Building a reliable research database requires documenting detailed patient parameters. Investigators must record carrier statuses, testing timelines, age of onset, and disease phenotypes across all generations. Custom color codes help highlight specific symptoms or traits, making cohorts visible at a glance.
Research Standard: The 3-Generation Phenotype Audit
A clinical pedigree assignment must require the mapping of at least three biological generations. This includes the proband, their parents and siblings, and their grandparents, aunts, and uncles. Trainees must also document health histories (chronic illness, addiction, and mental health diagnoses) across all generations.
By documenting three generations, students learn to track relational dynamics like triangles and cutoffs. These systemic markers are crucial for formulating effective treatment plans. Adherence to these strict parameters forms the basis of clinical grading.
Pedigrees serve as rich data tables when structured correctly. Software tools allow researchers to link phenotypic data directly to individual family nodes, maintaining a record for statistical analysis.
Epidemiological Findings: Pedigree Mapping in Large-Scale Studies
Epidemiological research shows the diagnostic power of pedigree databases. Visual histories help researchers predict risks for chronic conditions like heart disease or diabetes, where genetic markers interact with shared household environments.
Using standardized visual formats improves data accuracy in large-scale studies. The dual canvas allows researchers to collect patient details and analyze family structures simultaneously, improving data tracking.
Research and Integration Metrics
Phenotype Tracking: Over eighty percent of investigators report that dedicated software reduces metadata errors compared to using generic diagrams.
FHIR Integration: Standardized FHIR genomics exports reduce data preparation times by thirty percent for external risk analysis.
Compliance Audits: Local-first data storage ensures clinical trials comply with GINA and HIPAA privacy standards.
Data Security: Compliance, Local Storage, and Multi-Site Workflows
Transitioning to digital instruction requires evaluating classroom setups, license models, and student security. General whiteboard tools lack the specific clinical shapes needed for family mapping, forcing students to draw components manually.
Data privacy is a core concern in clinical instruction. Genosm operates on a local-first model, saving all family assessment details in the student's browser database. No student work or patient details are sent to external servers, aligning with HIPAA and university privacy standards.
LMS compatibility is crucial for efficient homework management. Students can export completed maps as clean PDFs or PNGs to upload directly to Blackboard or Canvas. This ensures smooth submission and review processes.
Clinical Case Simulations: Standardized Mapping in Genosm
Case 1: The Hernandez Family — Intergenerational Resilience and Health
This case study follows the **Hernandez Family** across three generations, illustrating how economic hardship and chronic health conditions (Type 2 Diabetes) ripple through a system. As the index person, **Mateo** (b. 1990) struggles with balancing care for his elderly parents while managing his own early-stage symptoms. Students should note the use of "Very Close" relationship lines between Mateo and his mother, Elena, highlighting the cultural and emotional enmeshment common in high-stress caregiver roles.
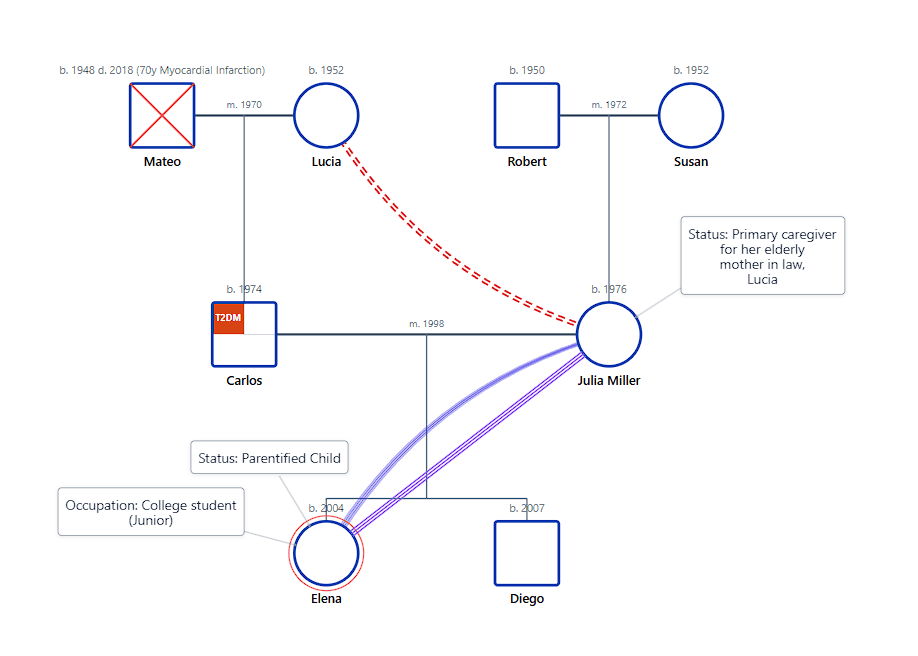
Figure 1: Mapping chronic illness (Diabetes) and caregiver enmeshment across a three-generation immigrant family system in Genosm.
Case 2: The Thompson-Chen System — Triangulation and Blended Families
The **Thompson-Chen** case is a masterclass in mapping post-divorce complexity and the systemic "Triangulation" of children. This diagram tracks **Kai** (b. 2010), who is caught in a high-conflict emotional triangle between biological parents David and Alice. The use of a dedicated Triangulation (T) indicator and red "Hostile" zigzag lines demonstrates the child's role as a stabilizer for parental conflict. The addition of David's new marriage to Sarah provides students with a visual language for blended family stressors.
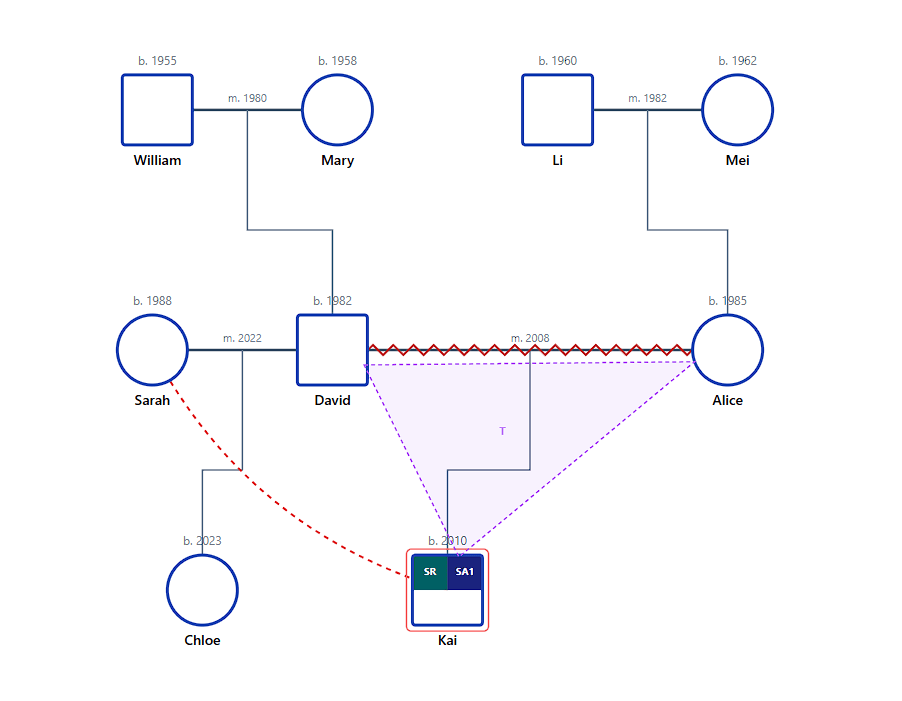
Figure 2: Visualizing high-conflict divorce and the triangulation of children using standardized clinical markers.
Case 3: The O'Reilly Family — Addiction Cycles and Systemic Roles
The **O'Reilly** case study examines the impact of multi-generational Alcohol Use Disorder (AUD). It specifically highlights "Family Roles" that emerge in addicted systems: the **Hero** (Finn), the **Scapegoat** (Roisin), and the **Lost Child** (Callum). Students can observe the intergenerational patterns of cutoff (red bars) and enmeshment (green railway tracks). This case demonstrates how a genogram serves as a diagnostic engine to identify systemic roles that maintain clinical symptoms.
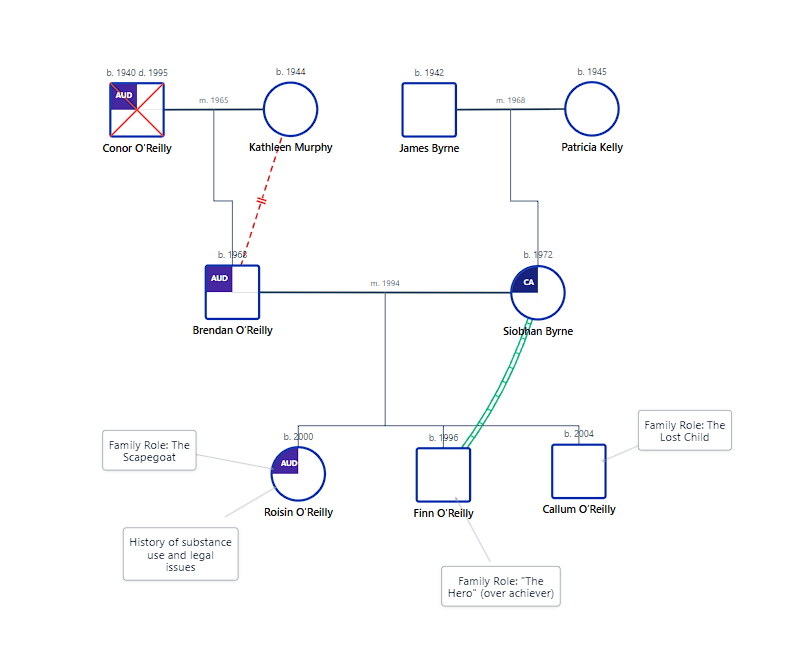
Figure 3: Mapping intergenerational addiction, toxic family roles, and emotional cutoffs in the O'Reilly system.
Tools, Security, and professional optimization
While manual drafting was once the standard in clinical training, modern programs increasingly advocate for digital optimization. Platforms like Genosm provide a dedicated "palette" of drag-and-drop clinical components designed specifically for university assignments. This allows students to focus on high-level clinical conceptualization rather than the logistics of manual drawing. The result is a cleaner, more professional, and technically accurate submission that meets the highest academic standards.
Digital efficiency is further enhanced through AI-augmented generation. Students can input familial narratives in plain language and have a valid genogram generated in seconds. This automation respects the professional symbology rules while dramatically reducing the time required for administrative drafting. This efficiency is critical for trainees managing high academic loads and multiple internship cases simultaneously.
Data security and privacy are non-negotiable requirements, even for academic exercises. Sensitivity regarding family information remains constant whether the data is for a real client or a student assignment. Genosm utilizes a local-first design where all personally identifiable information (PII) is stored directly on the student’s device. This architecture ensures that data never touches centralized third-party servers, meeting the highest privacy standards by design.
Conclusion, The transition to Professionalism
The genogram assignment is the bridge between clinical theory and professional assessment. By moving beyond linear family trees and adopting a multigenerational visual standard, healthcare trainees gain the precision needed to identify risk, hypothesize systemic causes, and promote holistic health outcomes. This methodology is the foundation of high-authority professional practice.
Software Comparison: Finding the Best Mapping Tool
Trainees completing family assessment assignments need a tool that balances clinical standard symbols, auto-layout capabilities, and quick revisions. Here is how dedicated student software compares with traditional presentation or drawing methods:
| Assessment Feature | Genosm Software | Microsoft PowerPoint | Paper & Pencil | ||||||||||||||||||||||||||||||
|---|---|---|---|---|---|---|---|---|---|---|---|---|---|---|---|---|---|---|---|---|---|---|---|---|---|---|---|---|---|---|---|---|---|
| Standard Notations | Built-in McGoldrick and NSGC guidelines | Manual creation of shapes and symbols | Completely hand drawn (prone to error) | ||||||||||||||||||||||||||||||
| Structural Adjustments | Auto-layout aligns nodes and paths instantly | Requires manual repositioning of every shape | Requires eraser and complete redraw |
| Research Feature | Genosm Tool | Biogistry Workbench | Spreadsheet (Excel) | General Chart Maker |
|---|---|---|---|---|
| Phenotype Customization | Custom trait colors and detailed node metadata | 17+ calculations, custom phenotypes & HPO lookup | Text list entries only (no visual connections) | Manual shape color edits only |
| FHIR Export Compatibility | Full FHIR R4 FamilyMemberHistory schemas | Full FHIR R4 & HL7 data export | None (requires custom script translation) | None (proprietary drawing files only) |
| 10+ Clinical Risk Models | Mendelian pattern detection | Built-in 10+ models (BOADICEA, Tyrer-Cuzick) | None | None |
| Participant Security | Local-first browser database and client encryption | Zero-knowledge local architecture | Local file storage (susceptible to loss) | Cloud servers (participant PII exposed online) |
| Multi-Site Share & Collaboration | Peer-to-peer secure JSON file sharing | High-quality team collaboration | Shared cloud file folders | Cloud-based shared whiteboard folders |
Excel spreadsheets keep track of lists but fail to visualize genetic inheritance. General flowchart builders are easy to share online but expose participant details to cloud servers and lack clinical phenotype indicators. Genosm provides a local-first clinical mapping tool tailored to genomic research and trial regulations.
Frequently Asked Questions
How do clinical researchers use family mapping software?
Clinical researchers use family mapping software to visualize phenotypic inheritance patterns, document multi-generational medical cohorts, and analyze genetic correlations across study participants.
Can researchers export pedigree data in structured formats?
Yes, Genosm allows exporting data as structured JSON files, FHIR genomics-ready resources, and high-resolution PDF diagrams for clinical reports.
Is patient and participant data secure?
Yes, Genosm features local-first storage. Patient personally identifiable information (PII) is encrypted and saved in the user's browser, ensuring no sensitive data leaves the device.
Does this software support Mendelian risk calculation systems?
Yes, our tool exports standard JSON schemas that can be directly imported into external calculators like BRCAPRO or Cyrillic for advanced statistics.
Can we track custom phenotypes or conditions?
Yes, researchers can define custom parameters and color codes to track specific diseases, environmental influences, and phenotypes across the study system.
Advanced Research Pedigree Tools
Standardize clinical trials and cohort assessments with Genosm.
View Research Plans