Launch Builder Start Mapping Your Family Tree Online
Genosm Pro includes AI genogram making, advanced notations, emotional relationships, health marking, export in high quality, custom branding and more. You can also use the free tool with limited capacity but enough for prototyping.
Introduction: Why Map Family Systems with a Genogram?
In clinical practice, therapists, nurses, and social workers need to look past simple genealogies. While a standard family tree maps direct descent lines, a clinical genogram maps a detailed social system. It uncovers complex intergenerational patterns, shows hereditary conditions, and illustrates the multigenerational transmission of behaviors, anxieties, and psychological inheritance.
Using a genogram helps clinicians organize complex data that standard text-based intake notes easily miss. Developed through Murray Bowen's family systems theory (which laid the foundation for modern Bowen family systems assessment) and later standardized by Monica McGoldrick, this mapping standard is critical for thorough clinical assessment.
Drawing diagrams by hand or struggling with non-clinical flowchart tools is frustrating. A specialized genogram creator like Genosm handles the styling for you. You can focus on analyzing client history instead of manual formatting.
The Case Study: Introducing the Carter-Bell Family
To help you learn how to draw a genogram easily, this guide walks through a real family case study. Our index client is 16-year-old Leo Carter, who has been brought to therapy by his parents, Greg Carter and Helen Bell. Leo is experiencing academic decline, high stress, and has been diagnosed with Catecholaminergic Polymorphic Ventricular Tachycardia. His pediatrician suspects these physiological issues are exacerbated by ongoing family tension.
The main goals of our assessment are to map the family network to discover intergenerational stressors, identify hereditary medical risks, examine emotional relationship patterns (such as conflicts or enmeshments), and create a supportive roadmap for Leo's health. To resolve these clinical goals, you need to build a detailed genogram. The step-by-step instructions below will guide you through this process.
Phase 1: Preparing to Draw and Gathering Family Information
Before learning how to make a genogram, you need to collect structured data from the client. Focus on identifying the index person (the client under assessment, also called the identified patient). Collect information across three generations, detailing names, biological connections, health histories, and emotional relationships.
To simplify this step, you can use our free online genogram intake form tool to gather all the necessary information easily. Clinicians can print this intake form and ask clients to fill it out directly, or verbally ask the queries one by one while keeping the form filled with detailed data before printing.
The table below outlines the specific inquiries to make during client interviews to build a complete family genogram example:
| Inquiry Category | Information to Collect | Clinical Rationale |
|---|---|---|
| Structural Details | Full names, birth years, death years, marriages, divorces, separations, and sibling birth orders. | Forms the primary structural bones of the family map and tracks demographic patterns. |
| Health History | Chronic illnesses, mental health conditions, causes of death, age of diagnosis, and substance use. | Performs critical health history mapping to find genetic and biological vulnerabilities. |
| Emotional Dynamics | Patterns of conflict, distance, close ties, estrangements, abuse, or enmeshment between pairs. | Reveals relational stressors, anxiety transmission, and psychological boundaries. |
Leveraging AI for Intake Reductions
If you are using Genosm, you do not have to draw every node from scratch. Clinicians can simply copy the narrative text block of their client's family assessment directly from the intake tool, paste it into Genosm's AI Genogram Tool, and let the artificial intelligence construct the nodes, biological links, and generations in seconds.
Phase 2: Drawing the Grandparent Generation (Generation 1)
Let us construct our 3 generation genogram example using the Carter-Bell family. Start with the oldest generation at the very top of the canvas, split into two sides: the paternal grandparents on the left and the maternal grandparents on the right.
To establish standard clinical genogram standards, follow these structural rules:
- Squares denote male members. Circles denote female members.
- Write the age inside the shape (e.g., 76 inside Arthur's square) if you don't have to add health conditions later, because clinical shading patterns for health conditions are displayed within the shapes; if you have health conditions, you can write the age and birth-death details on top of the shape instead.
- Write the name and birth/death years outside the shape, typically below it.
- The male partner is placed on the left side of a couple connection. The female partner is placed on the right.
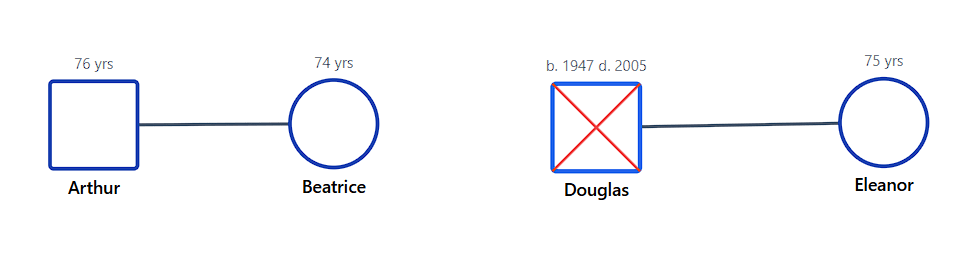
Figure 1: Grandparents Arthur (76) and Beatrice (74) placed on the paternal left side; Douglas (79) and Eleanor (75) placed on the maternal right side.
In this case, Douglas Bell has passed away. In clinical diagrams, a deceased status is shown by drawing a large "X" directly through the individual's shape.
Phase 3: Building the Parent and Sibling Levels (Generation 2)
Below the grandparent row, drop vertical lines from each couple's horizontal relationship line to map the sibling level. Maintain a strict sibling placement birth order: place siblings from left to right, going from the oldest sibling to the youngest.
- The Carter Family (Paternal side): Arthur and Beatrice have two children. Sibling 1 is Charles (48), Sibling 2 is Greg (45).
- The Bell Family (Maternal side): Douglas and Eleanor have three children. Sibling 1 is Helen (44), Sibling 2 is Ian (42), Sibling 3 is Karen (39).
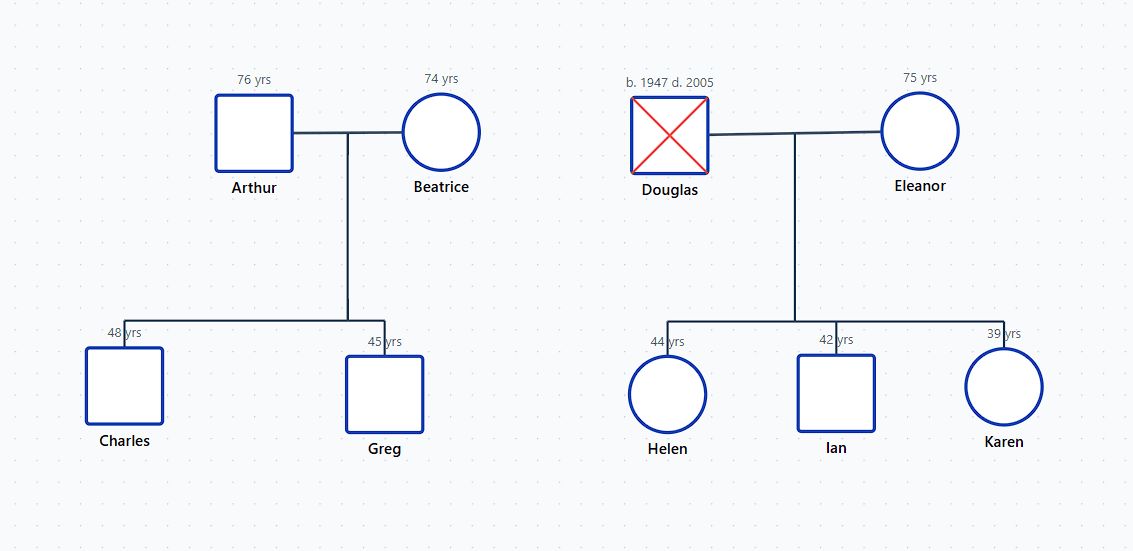
Figure 2: Sibling branches added below grandparents. Charles (oldest) sits left of Greg. Helen (oldest) sits left of Ian and Karen.
To keep alignments clean, standard genogram software for social workers like Genosm uses a grid layout. This helps you align generational rows automatically so sibling branches do not cross over.
Phase 4: Linking the Two Family Lines (The Marriage Connector)
In this case, the first couple's second child (Greg Carter) and the second couple's first child (Helen Bell) are married. They act as the primary connection link between the two large family networks.
To connect them:
- Draw a horizontal line below Greg and Helen to represent their relationship. This acts as the marriage line connector.
- Label the line with a lowercase "m." followed by their marriage year (e.g., "m. 2008").
- Because Charles and Ian are also married to partners outside this diagram, you can add small branches to Fiona and Julia next to them. However, keep Greg and Helen centrally aligned since they link the families.
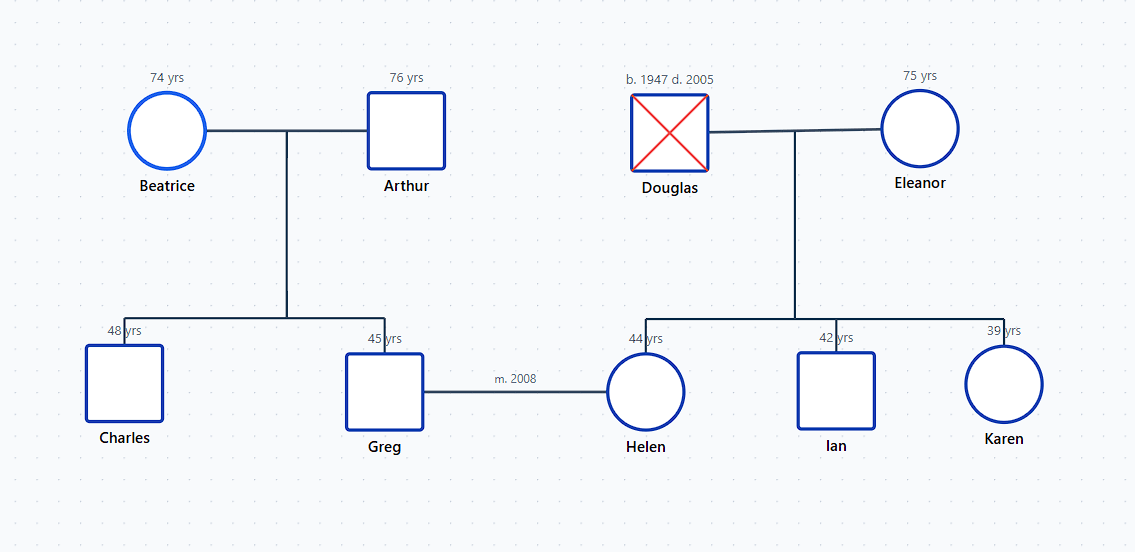
Figure 3: A solid horizontal connector line joins Greg Carter and Helen Bell, showing their marriage in 2008.
Phase 5: Adding the Bottom Level (Generation 3)
The bottom level contains the children of the married connectors. Drop a vertical line from the middle of the Greg-Helen marriage line, then split it horizontally to place their two children: Sibling 1 is Leo (16), Sibling 2 is Mia (12).
Leo is the primary subject of our family intake, which makes him the index person. In clinical drawings, the index person is highlighted using a bold double-line border around their shape (a double square for males, or a double circle for females).
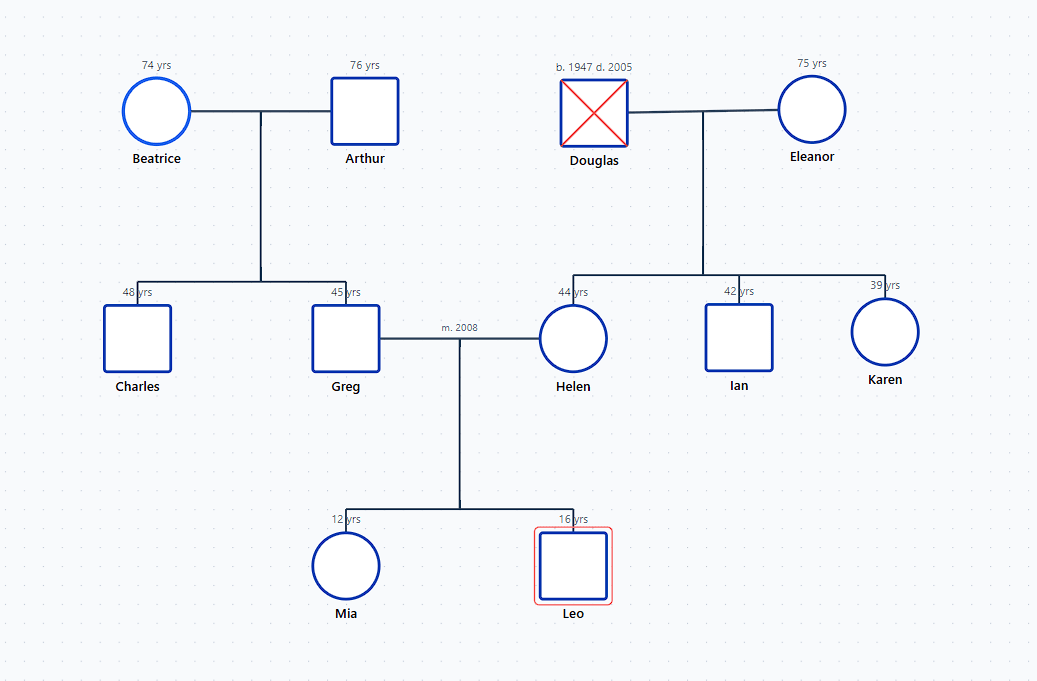
Figure 4: Generation 3 drops below Greg and Helen. Leo (16) is shown on the left with a double-bordered square as the index person.
Phase 6: Mapping Multi-Generational Health and Hereditary Conditions
Genograms serve as a highly functional medical pedigree chart builder. In our case study, cardiovascular disease acts as a hereditary threat across all three generations:
- Gen 1 (Paternal Grandfather): Arthur (76) has diagnosed coronary heart disease.
- Gen 1 (Maternal Grandfather): Douglas died at 79 due to a sudden myocardial infarction.
- Gen 2 (Father): Greg (45) is diagnosed with coronary artery disease and chronic hypertension.
- Gen 3 (Son): Leo (16) is diagnosed with Catecholaminergic Polymorphic Ventricular Tachycardia.
Review the medical genogram symbols and shading rules used for tracking these hereditary conditions in the table below:
| Condition Type | Color Standard | Visual Display Pattern | Case Study Application |
|---|---|---|---|
| Heart Disease (Cardiovascular) | Red | Solid red fill or split-color shading | Applied to Arthur, Douglas, Greg, and Leo. |
| Anxiety / Depression (Mental Health) | Blue | Dotted fill or split-color segment | Applied to Eleanor and Helen. |
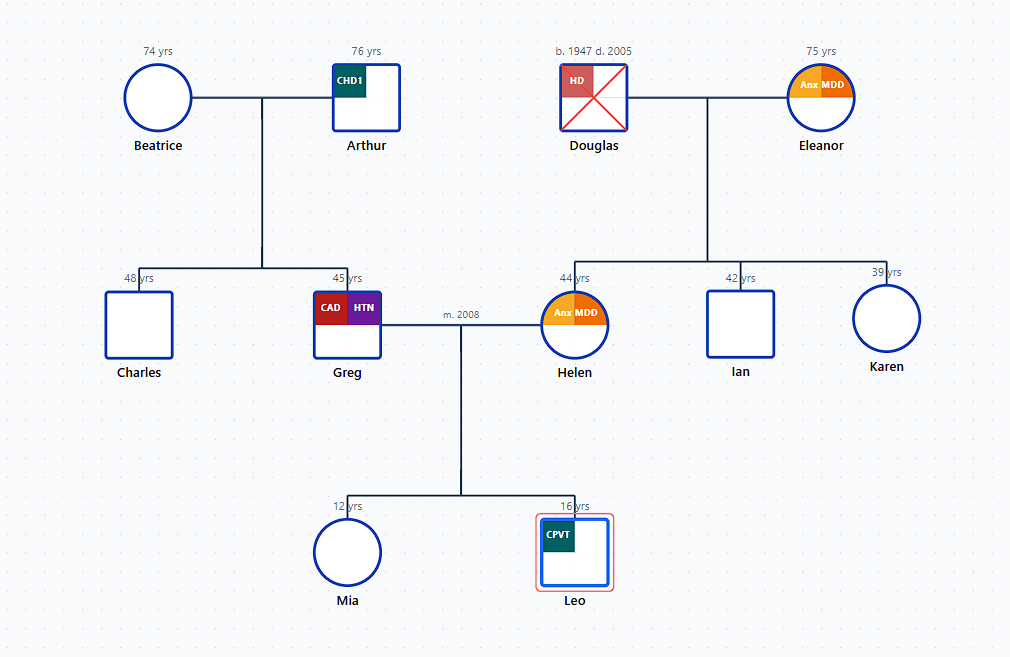
Figure 5: Nodes for Arthur, Douglas, Greg, and Leo are colored red to visually trace the cardiovascular disease lineage.
Genosm supports split-color and quadrant-based shading. This is especially helpful if a person has multiple diagnoses: for example, if Eleanor Bell has co-occurring anxiety and cardiovascular disease, you can color half of her shape red and the other half blue.
Phase 7: Mapping Emotional and Social Relationships
In addition to mapping biological ties, a genogram tracks psychological dynamics. Use customized genogram relationship lines to connect individuals and illustrate their relational health.
Our Carter-Bell case study includes three specific relationship types:
- Enmeshed/Close Connection: Helen and her mother Eleanor share a supportive, highly close bond. This is shown by drawing a double solid line between them (the enmeshed relationship line).
- Hostile Connection: Greg and his older brother Charles have a conflict-ridden relationship due to an unresolved family business dispute. This is drawn as a jagged zigzag line (the hostile relationship symbol).
- Distant Connection: Greg and his detached father Arthur have a poor emotional bond. This is shown using a single dashed line (the distant relationship notation).
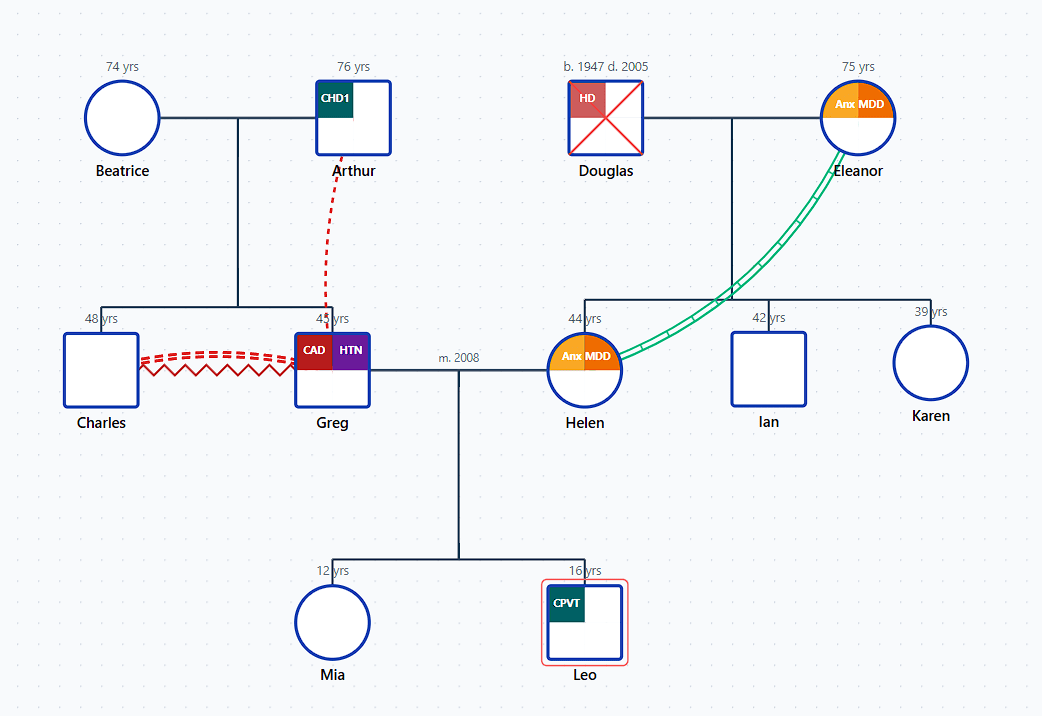
Figure 6: Visual legend of relationship patterns: solid double lines denote enmeshment; jagged lines show hostility; dashed lines represent distance.
Phase 8: Adding Household Boundaries and Text Notes
To indicate who lives in the same house, draw a large dashed loop surrounding the specific family members. This represents the living together household boundary.
In our case study:
- Greg, Helen, Leo, and Mia live together in Seattle. Draw a dashed bounding rectangle around their shapes.
- Arthur and Beatrice live together in their retirement home. Draw a separate dashed loop around them.
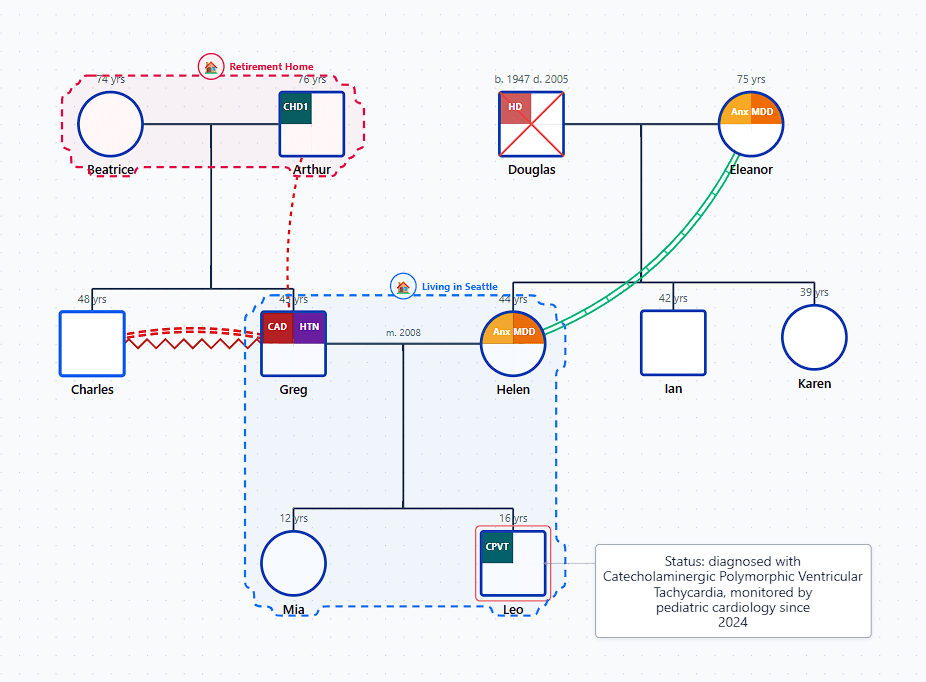
Figure 7: Dashed loop surrounding Greg, Helen, Leo, and Mia to identify the primary cohabitating family group.
Finally, add clinical notes directly onto the canvas. Mention specific dates, treatments, or critical observations (e.g., "Leo: diagnosed with Catecholaminergic Polymorphic Ventricular Tachycardia, monitored by pediatric cardiology since 2024").
Phase 9: Finalizing, Exporting, and Sharing Your Genogram
Once the drawing is complete, double-check all birth years, sibling orders, and relationships for clinical accuracy.
Genosm supports several high-resolution export options to save your family map:
- Vector SVG: Best for embedding inside electronic health records (EHR) or clinical intake files without losing resolution quality.
- Clean PDF: Ready for printing or appending as a physical handout.
- Secure Guest Links: Ideal for collaborative sessions where the client can log in and update elements of their history in real-time.
Importing Case Study Data
Instead of drawing the Carter-Bell family from scratch, you can easily load it into the Genosm editor. Download the verified JSON configuration below, navigate to your Genosm workspace, click the Import button, and select the file. You will immediately see the complete family genogram rendered on your canvas. Feel free to play with the layout, edit details, or start a new project. You can also export your work back as a JSON file at any time and import it on any device to see the exact same genogram.
* Note: Please do not edit this JSON file manually before importing as it may break the file integrity checks of the import engine. Simply import it as-is and edit it visually on the canvas.
Frequently Asked Questions About Creating and Building Genograms
What is the difference between building a genogram and a family tree?
While a traditional family tree or family pedigree chart only tracks biological lineage and basic dates, generating a genogram captures complex emotional relationships, social bonds, behavioral patterns, and multi-generational medical histories. It is an active clinical tool used in family therapy, nursing, social work, and genetic counseling rather than just a simple genealogical record.
What are the standard rules for drawing a genogram?
Standard clinical rules dictate that males are represented by squares and females by circles. The male partner is placed on the left, and the female partner is placed on the right of any relationship line. Sibling branches must be placed below the parent line and sorted strictly by birth order from left (oldest) to right (youngest). Deceased members are marked with a large "X" through their shape.
How does generating a genogram with AI work?
Building a genogram with Genosm's AI Genogram Tool is simple. Instead of dragging and dropping individual shapes or drawing lines manually, you can paste a narrative description of a family's history. The AI parses the text, extracts the family members, matches their generations, and maps out the genetic pedigree automatically, saving hours of manual layout configuration.
Can I export and share my genogram across devices?
Yes. When you are done building a genogram on Genosm, you can export it as a clean JSON backup file. This file contains the complete structured data of your genogram. You can import this JSON file on any device running Genosm to resume editing or presenting without losing layout precision or clinical markers. You can also export high-resolution PDFs, SVGs, or PNGs for clinical reports.
Conclusion: Elevating Your Clinical Case Assessments
Creating a genogram is one of the most effective ways for clinicians, family therapists, social workers, and genetic counselors to analyze complex systemic dynamics. By drawing relationships, tracking hereditary health patterns, and documenting household borders, you build a comprehensive visual map that highlights issues which textual records might fail to clarify.
With modern digital solutions like Genosm, you no longer have to struggle with manual spacing, overlapping lines, or disconnected shapes. Whether you are generating a genogram automatically using our advanced AI engine or mapping out family structures manually using our precise drag-and-snap dot grid editor, you can build clear, professional, and compliant genograms in minutes. Start diagramming today and streamline your clinical documentation workflow.
Start Creating a Genogram Online
Whether you are building a simple family pedigree chart or generating a complex multi-generational medical genogram, Genosm has the perfect tools for your clinical workflow. Choose between our lightweight free genogram builder or unlock advanced HIPAA-compliant clinical features, smart AI generation, and custom branding with our Premium Pro Plus plan.