Clinical Pedigree Chart Tool

The Pedigree Chart Builder
Built for Clinical Genetics

Draw, analyse, and export pedigree charts that meet clinical standards. Genosm automatically detects inheritance patterns, flags consanguinity, and generates narrative reports, so you focus on the family, not the formatting.

Start Building Clinical Pedigree Charts View Pricing
Used by genetic counselors and clinical geneticists HPO phenotype integration Automatic inheritance analysis NSGC-aligned symbols
Trusted by 89 clinicians using Genosm in active practice. No watermarks. No data sold to third parties.
Foundation

What Is a Pedigree Chart?

A pedigree chart is a standardized diagram that maps the biological relationships in a family across multiple generations, alongside health conditions, genetic variants, and clinical status. It is the primary tool in clinical genetics for visualizing how a trait or condition is transmitted from one generation to the next.

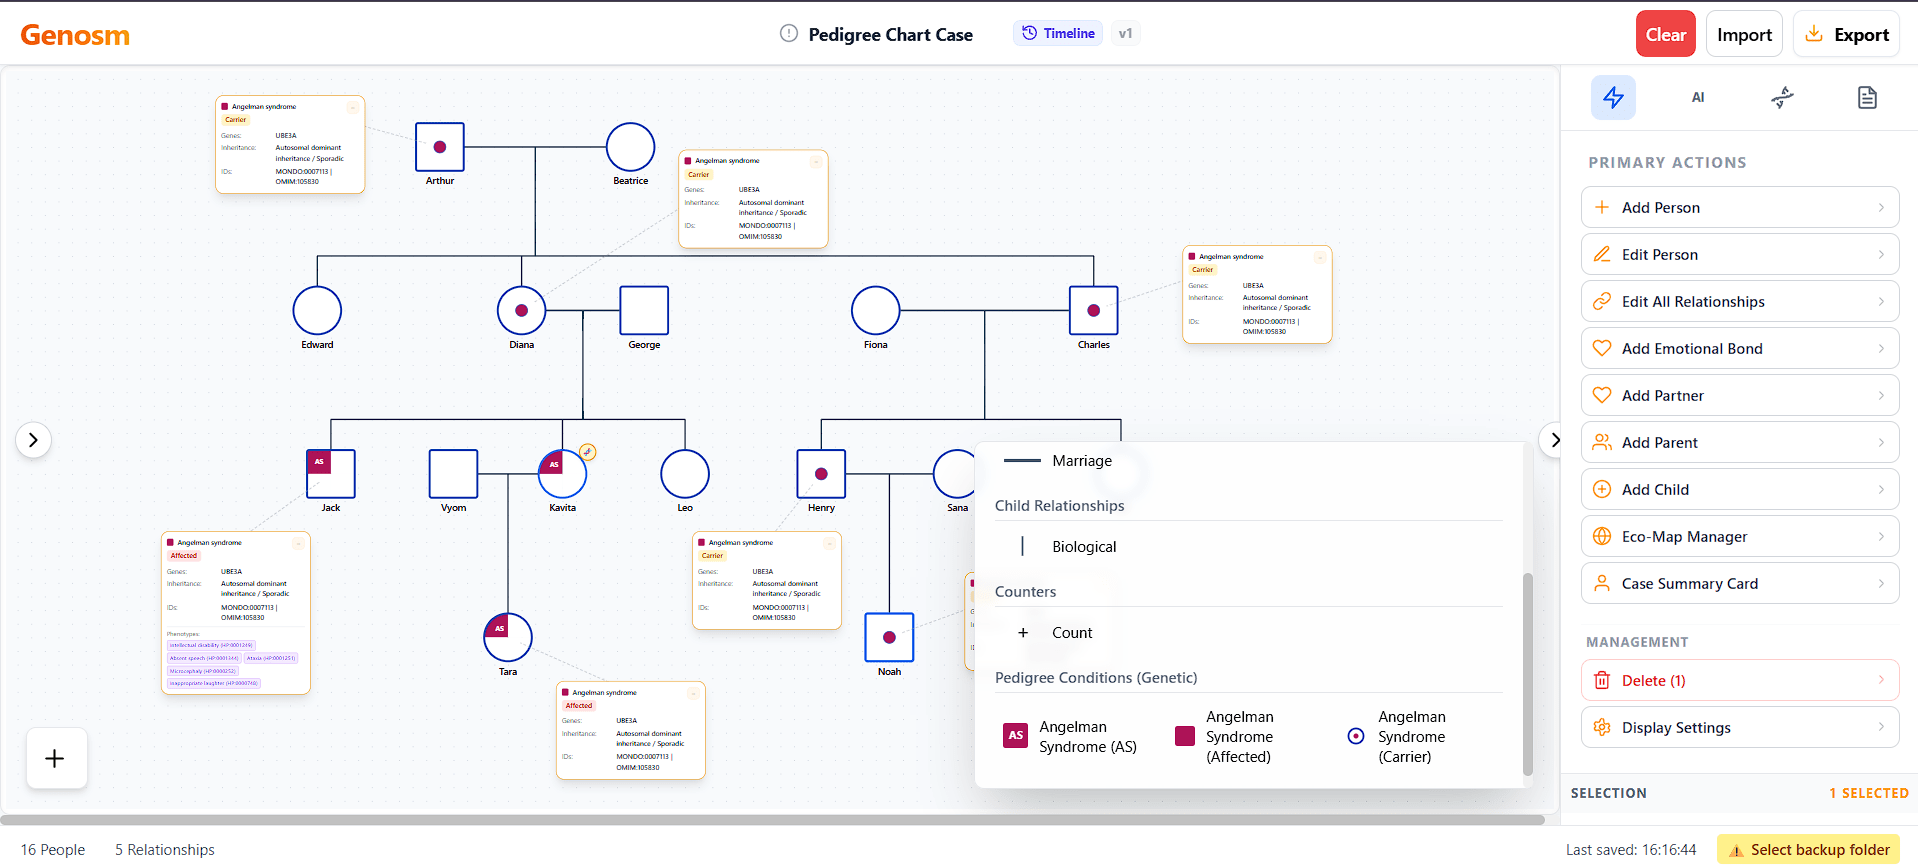
Squares represent males, circles represent females, and filled symbols mark affected individuals. Horizontal lines connect couples; vertical and angled lines connect parents to children. A double horizontal line indicates a consanguineous union. When you layer in genetic test results, HPO phenotype codes, age of onset, and carrier status, the chart becomes a diagnostic instrument rather than just a diagram.

Clinical pedigrees are used in genetic counseling intake, rare disease workup, cancer predisposition assessment, reproductive planning, research cohort characterization, and medical education. Standards from the American College of Medical Genetics and Genomics (ACMG) and the National Society of Genetic Counselors (NSGC) define the symbol set practitioners are expected to follow.

Pedigree Chart vs. Genogram: What Is the Difference?

A genogram extends the pedigree into psychosocial territory. Where a pedigree chart focuses on biological relationships and medical or genetic traits, a genogram adds emotional relationship quality, behavioral patterns, mental health history, substance use, and family role dynamics. Genograms are widely used in family therapy, social work, and systemic counseling.

Genosm supports both. The pedigree chart builder is purpose-built for clinical genetics workflows with HPO integration, inheritance analysis, and NSGC-standard symbols. The genogram module adds the psychosocial layer for therapists and social workers. You can run both on the same case.
Why Genosm

What Makes This Pedigree Chart Creator Different

Most pedigree chart tools stop at drawing. Genosm adds a full analysis engine, so the chart you build immediately tells you what the pattern likely is and exactly why.

AI Pedigree Chart Generation

Paste clinical case notes and the AI pedigree chart maker parses names, relationships, conditions, and generations into a complete chart. Handles complex multi-branch families in seconds.

🔬

Automatic Inheritance Pattern Analysis

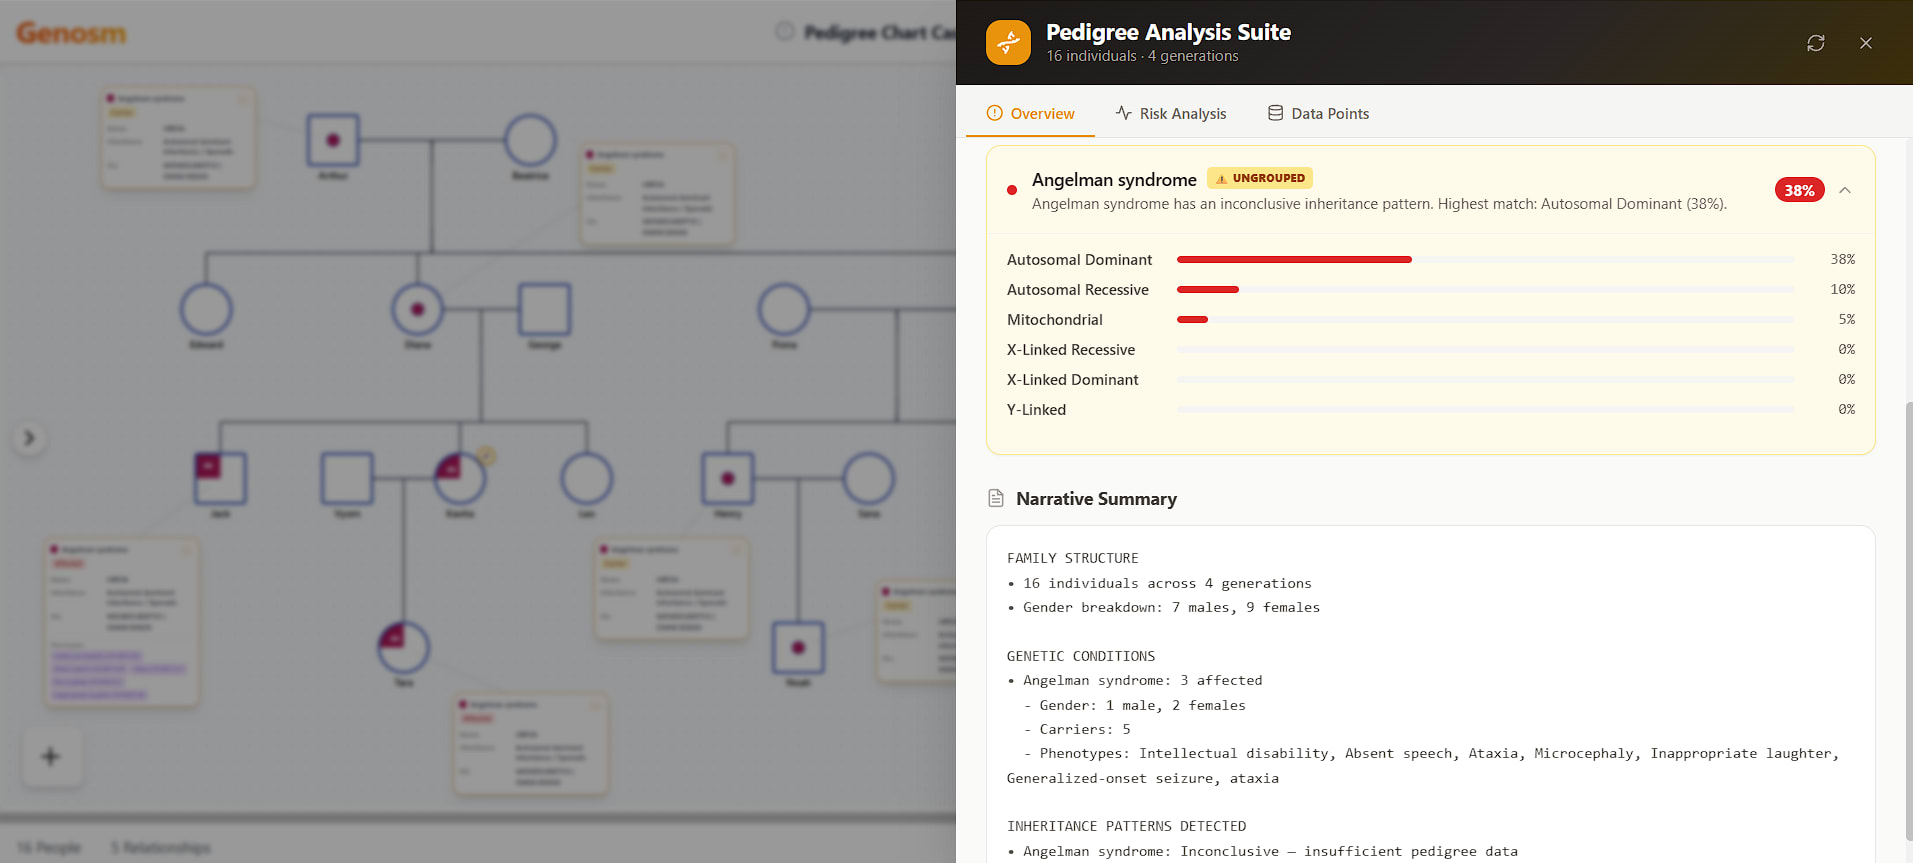
Every pedigree chart is run through a 6-pattern analysis engine. Autosomal dominant, autosomal recessive, X-linked recessive, X-linked dominant, mitochondrial, and Y-linked modes scored simultaneously, ranked by confidence.

📄

Full Explainability, No Black Box

Each classification ships with a complete criterion-by-criterion evidence trail. See exactly which transmission rules were met, which were not, and why a competing pattern was ruled out.

📒

HPO Phenotype Integration

Tag each individual with Human Phenotype Ontology (HPO) terms. Phenotypes appear on the canvas and are included in the clinical narrative report and PDF export.

👥

Syndrome Clustering

Families with HBOC, Lynch syndrome, Li-Fraumeni syndrome, or Cowden syndrome benefit from automatic condition grouping. Related conditions are analysed together as a hereditary unit.

🔒

Privacy-First, HIPAA-Aligned

Charts are stored locally on your device by default. AI processing uses a local PHI/PII Strip Guard before any text reaches external APIs. Your patient data stays yours.

How It Works

How to Build a Clinical Pedigree Chart in Genosm

From blank canvas to a complete pedigree chart with inheritance analysis in five straightforward steps.

1

Add your proband (index person)

Start with the patient presenting for evaluation. Mark them as the index person. Add sex, age, vital status, and any known genetic conditions or HPO phenotype codes.

2

Build out the family structure

Add parents, siblings, grandparents, children, and partners using the drag-and-drop panel. Relationships use NSGC-compatible pedigree symbols by default. Mark consanguineous unions with a double line. Add twin or multiple birth groups where relevant.

3

Record conditions and genetic test results

For each individual, add conditions with affected or carrier status, age of onset, genetic test type, and result (positive, negative, VUS, or inconclusive). Search by MONDO ID, OMIM number, or condition name using the built-in ontology lookup.

4

Run the inheritance analysis

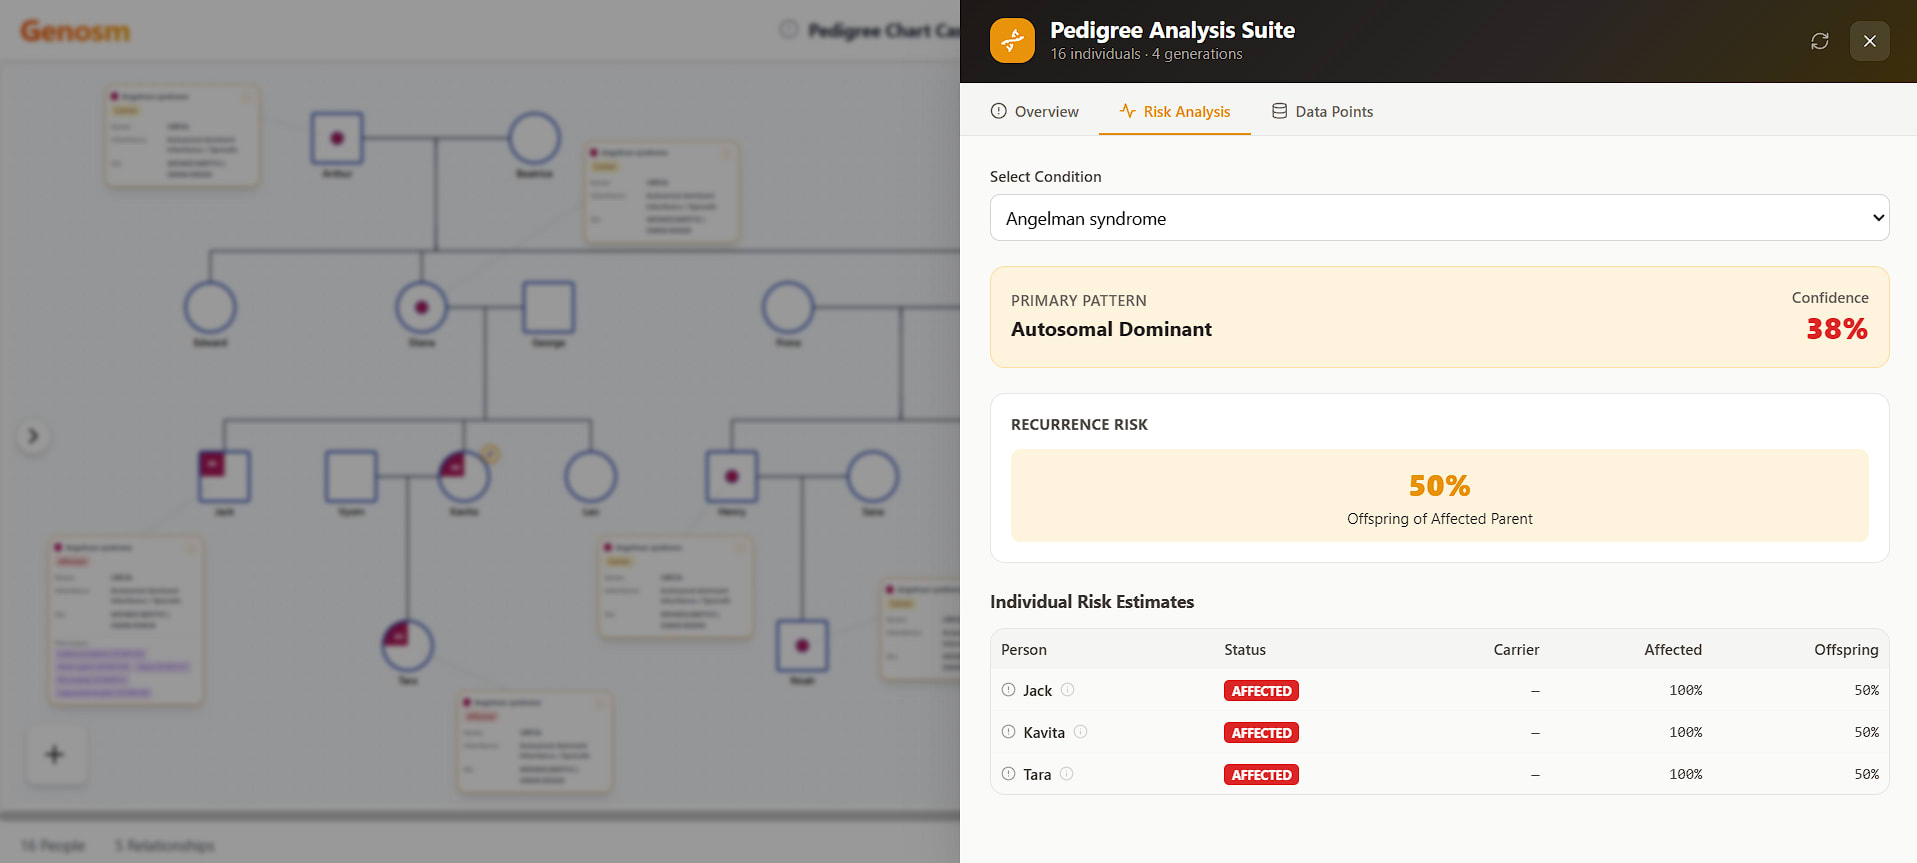
Open the Pedigree Analysis panel. The engine processes all conditions simultaneously, scores all six inheritance patterns, applies Mendelian exclusion rules, and returns a ranked classification with confidence scores and clinical flags within seconds.

5

Export the pedigree chart and clinical report

Export as a high-resolution PDF, PNG, or SVG. The clinical PDF includes the chart, narrative summary, inheritance classification, evidence trail, HPO phenotype list, and any flags raised during analysis.

Open the Pedigree Chart Builder
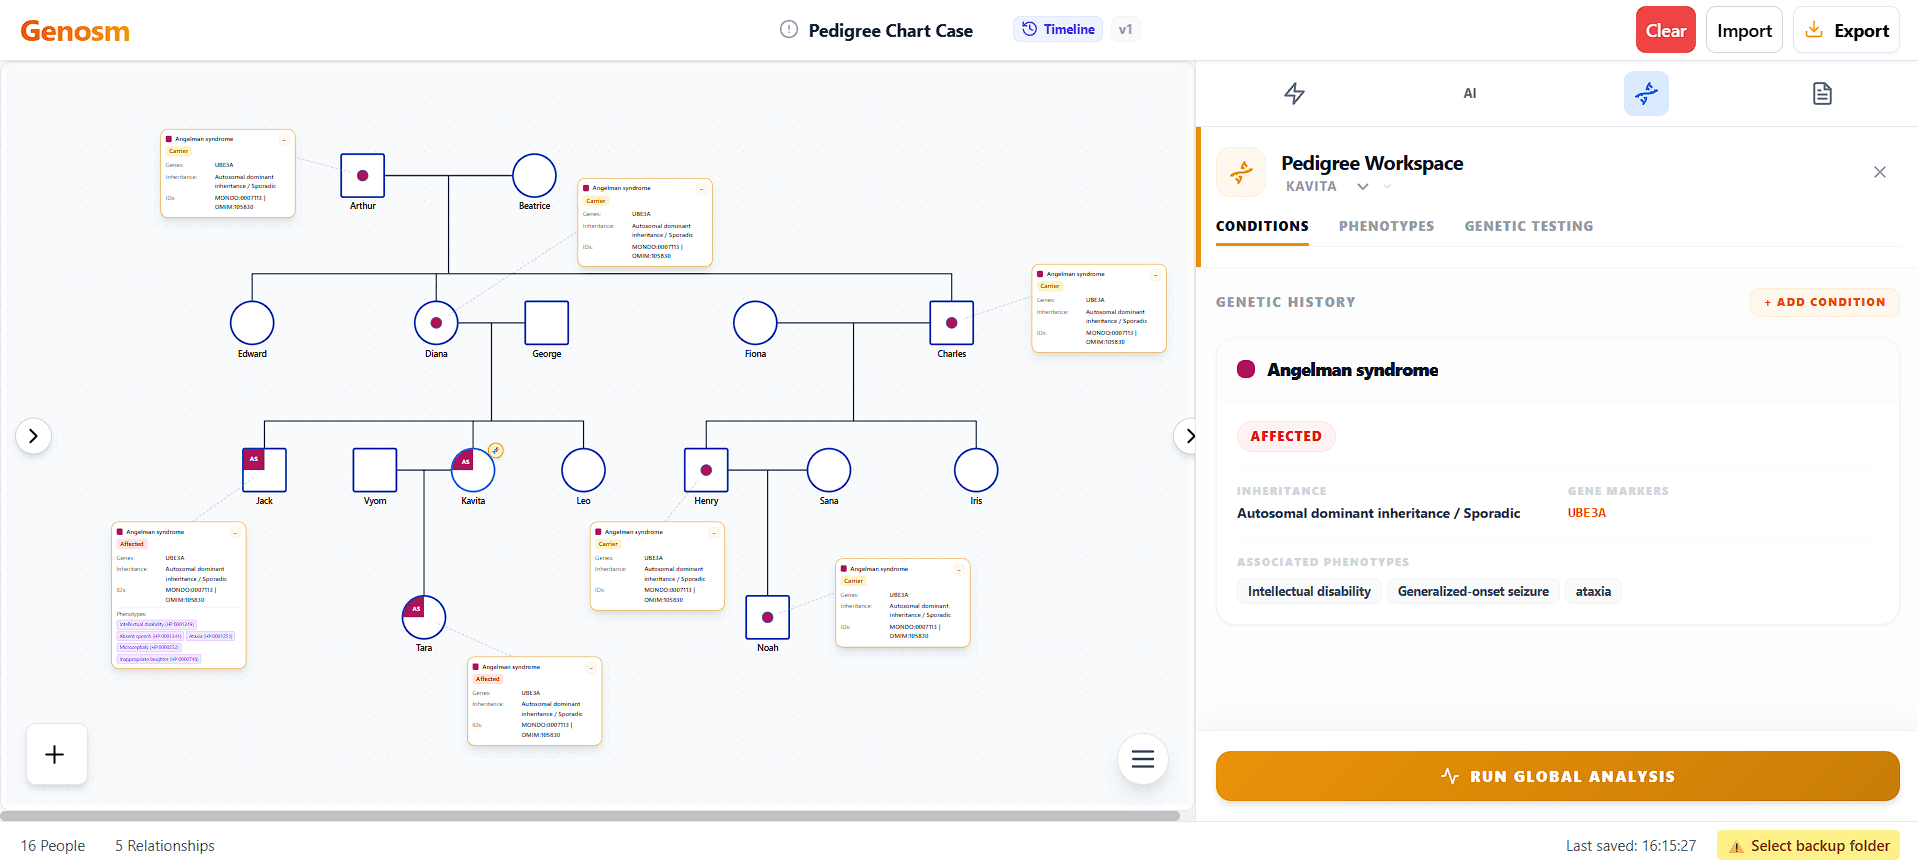
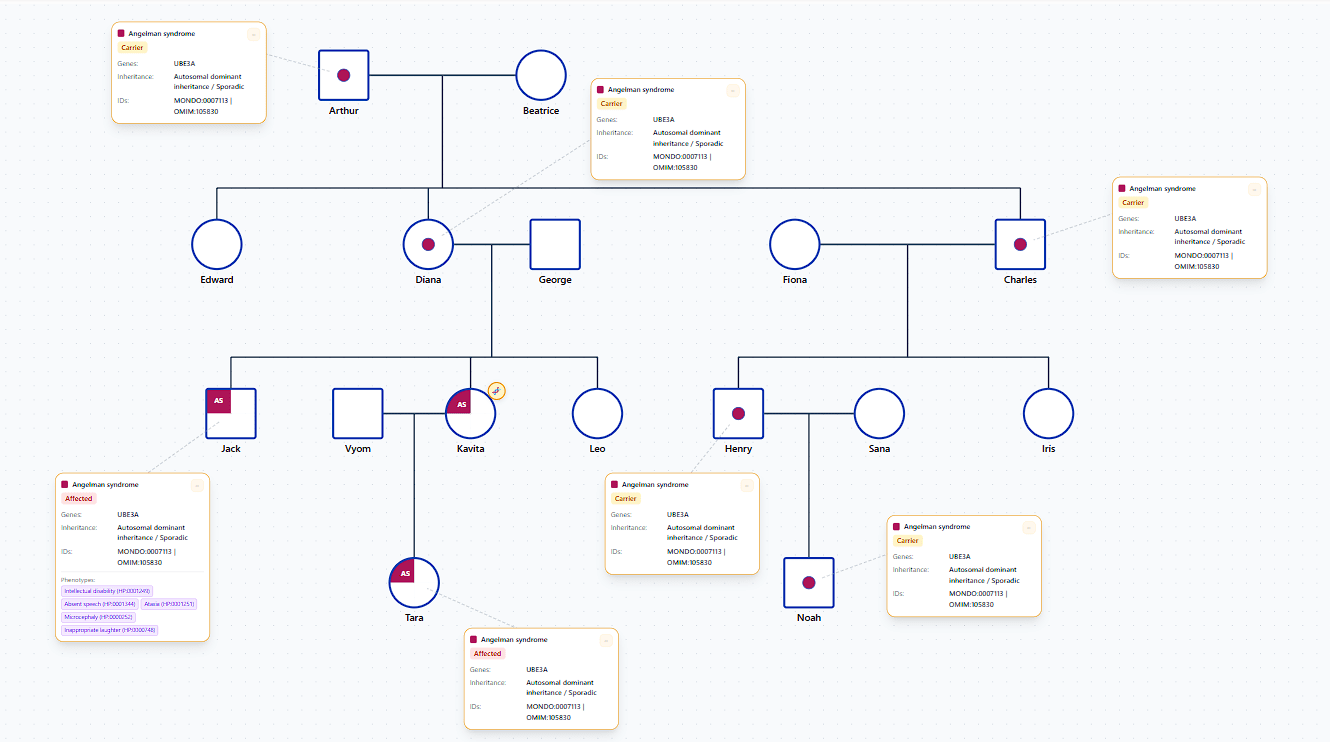
Genosm Pedigree Render: Angelman Syndrome Imprinting Case

Figure 1: Genosm's interactive pedigree rendering showcasing genomic imprinting transmission dynamics.

Interactive Case Study

Angelman Syndrome Genomic Imprinting Case

Angelman syndrome is caused by a pathogenic mutation or deletion in the maternal copy of the UBE3A gene. In central nervous system neurons, the paternal copy of UBE3A is naturally silenced (genomic imprinting), meaning only the maternally inherited copy is expressed.

This creates a distinctive pedigree pattern that standard Mendelian models classify as inconclusive, but which Genosm surfaces clearly:

  • Maternal Transmission (Active): Diana, the grandmother (Gen II-3), carries the mutation. Her children Henry (Gen III-2) and Kavita (Gen III-7) inherited her mutated allele and are clinically affected.
  • Paternal Transmission (Silenced): Kavita passes her mutation to her daughter Tara, who is affected. However, because Henry is male, his transmission to his son Noah is paternally silenced. Noah is a completely healthy carrier.
  • Imprinting Evidence: Genosm's pedigree builder displays this parent-of-origin transmission rule graphically, allowing clinicians to instantly differentiate active affected paths from silent carrier paths.
Analysis Engine

Every Inheritance Pattern the Analyser Covers

Every pedigree chart is evaluated against all six classical Mendelian inheritance modes simultaneously. Competing explanations are scored at the same time, not tested one by one.

AD

Autosomal Dominant

A single copy of the pathogenic variant on a non-sex chromosome causes the condition.

  • Appears in consecutive generations
  • Either sex can transmit; sons and daughters equally likely
  • Father-to-son transmission confirms autosomal origin
  • Examples: BRCA1/2, Huntington disease, Marfan syndrome, familial hypercholesterolaemia
AR

Autosomal Recessive

Two copies, one from each parent, are required. Carriers are clinically unaffected.

  • Typically skips generations; affected siblings with unaffected parents
  • Consanguinity substantially raises prior probability
  • Sons and daughters equally likely to be affected
  • Examples: Cystic fibrosis, PKU, sickle cell disease, Tay-Sachs disease
XLR

X-Linked Recessive

Carried on the X chromosome; one copy in males, two in females to cause disease.

  • Predominantly affects males
  • Never transmitted father-to-son (hard exclusion rule)
  • Carrier mothers transmit to roughly half of sons
  • Examples: Haemophilia A and B, Duchenne muscular dystrophy, colour blindness
XLD

X-Linked Dominant

One copy on the X chromosome is sufficient; both parental routes evaluated independently.

  • Affected fathers transmit to all daughters and no sons
  • Affected mothers transmit to roughly half of all children
  • Never transmitted father-to-son
  • Examples: Rett syndrome, MECP2 duplication, incontinentia pigmenti
MT

Mitochondrial

Inherited exclusively through the maternal line via mitochondrial DNA.

  • An affected mother transmits to all of her children
  • An affected father never transmits to any child
  • Sons and daughters affected equally
  • Examples: MELAS, MERRF, Leber hereditary optic neuropathy (LHON)
YL

Y-Linked

Carried on the Y chromosome; transmission is strictly paternal, father to every son.

  • Affects males only, in every generation of the male line
  • Every son of an affected father is affected
  • A father can never pass a Y-linked trait to a daughter
  • Examples: Y chromosome AZF deletions, some male infertility variants
Under the Hood

How the Pedigree Chart Analyser Works

The engine processes every condition through a five-stage pipeline. Hard biological exclusion rules run independently of scoring, so a high score can never override a transmission event that is definitionally impossible.

Stage 1

Pedigree normalisation

Builds the family graph: parents, children, partnerships, and generation depth. Handles individuals joining without recorded ancestry.

Stage 2

Multi-pattern scoring

All six modes scored at once: vertical vs. horizontal transmission, sex ratio, carrier transmission, consanguinity, parent-of-origin effects.

Stage 3

Mendelian exclusion

Hard-rule checks rule out patterns only when the pedigree makes them definitionally impossible, not merely atypical.

Stage 4

Cross-pattern reconciliation

Reference classifications and test results are checked across every condition cluster; competing evidence adjusts confidence scores.

Stage 5

Confidence calibration

Evidence converts to a bounded score, adjusted for genetic test concordance, scaled to the amount of available pedigree data.

Clinical Flags the Analyser Surfaces

Beyond pattern classification, the engine raises flags that a reviewer should check:

  • Consanguinity: A consanguineous union is present, raising the prior probability of autosomal recessive inheritance.
  • Single-generation pedigree: Affected individuals span only one generation; more family history would sharpen the classification.
  • Small pedigree: Fewer than four individuals recorded; confidence may understate true uncertainty.
  • Anticipation: Age of onset decreases across successive generations, a hallmark of trinucleotide repeat expansion disorders such as Huntington disease and myotonic dystrophy.
  • Discordant genetic test: A test result does not match the clinical presentation and deserves a second look.

Syndrome Clustering for Hereditary Cancer and Multi-Gene Conditions

Families with hereditary cancer syndromes rarely present with a single clean diagnosis. A family with breast cancer, ovarian cancer, and pancreatic cancer is far more informative analysed together as a possible HBOC cluster than as three separate conditions. Genosm automatically recognizes recurring clusters including HBOC, Lynch syndrome (HNPCC), Li-Fraumeni syndrome, Cowden syndrome, and Peutz-Jeghers syndrome, and applies reference classification context across the whole cluster.

Custom condition groups can be defined for research settings where novel syndromic presentations are being characterized outside these presets.

Clinical Use Cases

Who Uses the Pedigree Chart Generator

Genetic Counselors

Pedigree collection during genetic counseling intake is time-consuming. Genosm speeds up the structural work: build the pedigree from case notes using the AI parser, record conditions and test results, and let the analysis engine produce a first-pass inheritance classification before the counselor's formal review. The evidence trail is already there when it is time to explain the reasoning to the patient.

Clinical Geneticists

For complex multi-generation families with multiple conditions, manual pattern review across six possible inheritance modes is error-prone. The pedigree chart analyser evaluates every condition in the same pass and shows exactly which transmission criteria were met and which were not, condition by condition, giving the clinician a structured starting point rather than a blank page.

Hereditary Cancer Programs

Lynch syndrome, HBOC, and related cancer predisposition syndromes are defined by family history as much as by single-gene results. A pedigree chart with multi-generation data and syndrome clustering gives a cancer genetic counselor a defensible picture of familial risk that a single test result cannot provide on its own.

Genetics Researchers

Pre-screening pedigrees in a research cohort for inheritance patterns of interest is labour-intensive at scale. The analysis engine processes each pedigree asynchronously and returns ranked classifications with confidence scores, making it practical to triage which families warrant deeper sequencing or manual review.

Medical Genetics Students and Trainees

The evidence trail that ships with every classification doubles as a teaching tool. Instead of looking up whether a pedigree pattern is consistent with autosomal recessive inheritance, trainees can see the specific transmission criteria evaluated against the actual family, and why the engine ruled out competing hypotheses. Active learning, not passive reading.

Comparison

Genosm vs. Other Pedigree Chart Builders

Pedigree drawing tools have existed for decades. What they have not done, until now, is analyse what they draw.

Feature Genosm Progeny GenoPro PhenoTips FamGenix
Standard pedigree chart drawing Yes Yes Yes Yes Yes
NSGC-standard symbols Yes Yes Partial Yes Yes
Automatic inheritance pattern analysis (all 6 modes) Yes Limited No Limited Limited
Explainable evidence trail per classification Yes No No No No
HPO phenotype tagging with Monarch lookup Yes Partial No Yes Partial
Auto syndrome clustering (HBOC, Lynch, Li-Fraumeni) Yes, automatic Partial (Via BRCAPRO) No No Partial (Via risk models)
AI natural-language pedigree generation Yes No No No No
Anticipation and age-of-onset tracking Yes Yes Partial Partial Yes
Genogram mode for psychosocial mapping Yes No Yes (Primary focus) No No
Local-first privacy, no cloud PHI storage by default Yes Cloud & On-Premise Yes (Desktop app) Cloud & On-Premise Cloud only

Comparison based on publicly documented features as of 2026. Tool capabilities change over time.

FAQ

Frequently Asked Questions

What is a pedigree chart used for in genetics?

A pedigree chart is used to visualize how genetic conditions, traits, or variants are inherited across family generations. Clinicians use it to identify the likely inheritance pattern, assess recurrence risk, decide which relatives should be offered testing, and document family history in a standardized format for patient records and case review.

How is a pedigree chart different from a family tree?

A family tree records biographical relationships and life events. A clinical pedigree chart follows standardized medical symbols, includes health and genetic condition data, tracks affected and carrier status, and is designed to support inheritance pattern analysis. Genosm adds an automated analysis engine on top of the drawing tool.

Does the pedigree chart analyser replace a genetic counselor?

No. The engine produces a structured first-pass classification with a full evidence trail, intended to be reviewed by a qualified professional. It accelerates pedigree review; it does not replace clinical judgment.

Can I analyse multiple genetic conditions on the same pedigree?

Yes. Every condition recorded on the pedigree is evaluated in the same analysis pass. Recognized hereditary syndrome clusters like HBOC and Lynch syndrome are automatically grouped and analysed as a single hereditary unit. Custom condition groups can be defined for research purposes.

What happens with an incomplete pedigree?

The engine produces a best-available classification and explicitly flags limitations. A single-generation pedigree is flagged as such. A pedigree with fewer than four individuals is flagged as small. Confidence scores are deliberately suppressed when the data does not support precision.

Can I export the pedigree chart for patient records?

Yes. Export as a high-resolution PDF, PNG, or SVG. The full clinical PDF includes the chart, narrative summary, inheritance classification with confidence score, evidence trail, HPO phenotype list, and any clinical flags raised during analysis.

Is patient data secure?

Pedigree data is stored locally on your device by default. The AI generation feature uses a local PHI/PII Strip Guard to remove identifiers before any text reaches external models. Genosm does not sell or share clinical data with third parties.

Is there a free pedigree chart builder I can try?

Genosm offers a free trial that includes the full pedigree chart builder and analysis engine. No credit card is required for the first week. After the trial, a subscription is required for continued access to the clinical feature set.

Build Your First Clinical Pedigree Chart

Join genetic counselors, clinical geneticists, and researchers using Genosm. Start with a free trial, no credit card required for the first week.