Understanding the 3 Generation Rule in Family Systems Assessment
In clinical psychology, family therapy, and medical assessment, drawing a diagram that only includes parents and children provides an incomplete diagnostic picture. Single generation or two generation family maps show current interpersonal conflicts, but they fail to reveal the historical roots of systemic behavior. The three generation standard established by pioneer family systems theorists like Murray Bowen and Monica McGoldrick requires mapping at least three consecutive levels of a family lineage.
A complete three generation genogram displays:
- Generation I (Grandparents): Both maternal and paternal grandparents. This level documents birth dates, death dates, major physical illnesses, psychological diagnoses, substance use histories, and historical marital bonds.
- Generation II (Parents, Aunts, and Uncles): The index person's biological and adoptive parents, alongside all maternal and paternal aunts and uncles. This level records marriages, divorces, separations, step-relationships, and sibling birth orders.
- Generation III (Index Person, Siblings, and Children): The primary individual receiving assessment (denoted by a double square or double circle), their brothers and sisters, spouse or partners, and offspring.
Evaluating three generations reveals predictable human patterns. Anxiety, emotional cutoff, alcoholism, physical illness, and relationship triangulations tend to repeat across generations unless conscious therapeutic interventions occur. You can study standard notation rules in our Genogram Rules Guide or review visual symbol keys in our Genogram Symbols Standard.
Need to create a 3 generation genogram quickly?
Use the free online editor to build compliant diagrams in your browser without creating an account.
Detailed Clinical Case Studies: Real 3 Generation Examples
Case Study 1: The Sterling Family (Intergenerational Trauma and Triangulation)
The Sterling family genogram represents a complex three generation case involving severe trauma transmission, enmeshment, and emotional cutoff. Clinicians evaluating this case track how unresolved grief and domestic abuse in Generation I impacted parenting styles in Generation II, resulting in severe crisis symptoms in Generation III.
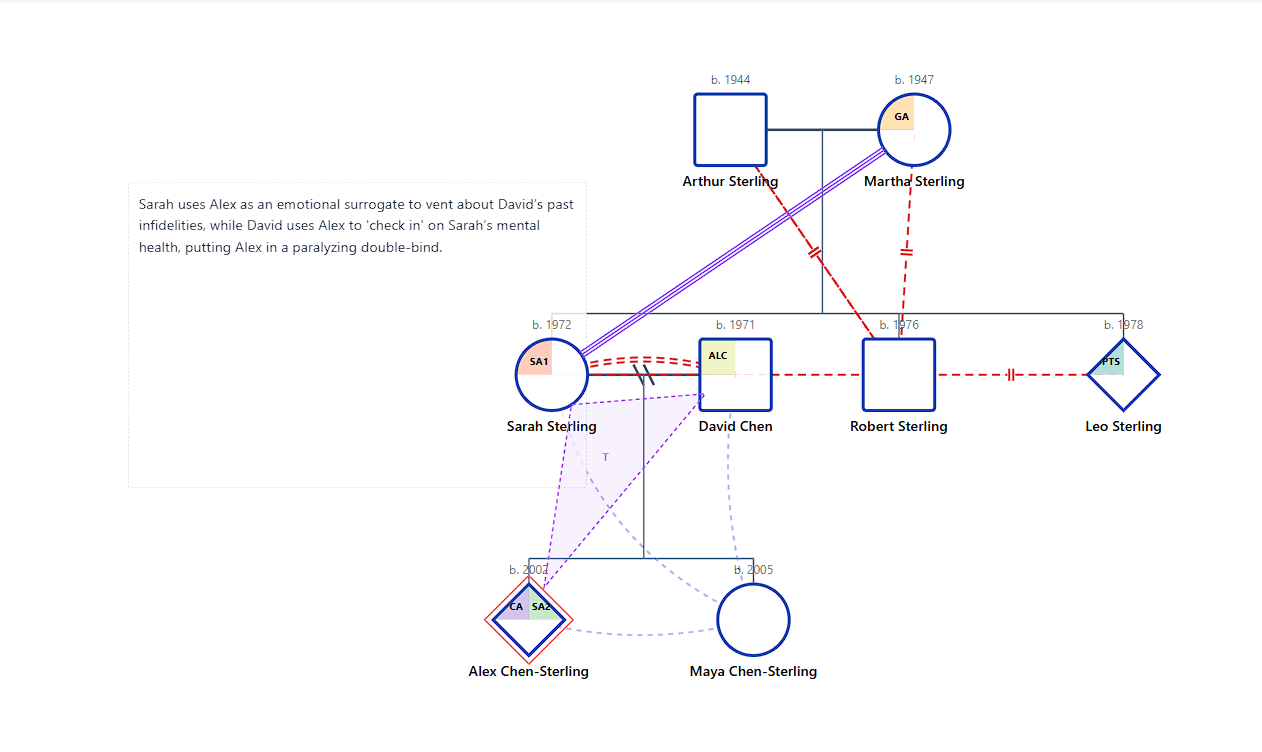
Figure 1: The Sterling Family Genogram displaying 3 generations of relational stress, enmeshment, and symptom transmission.
Clinical Assessment Breakdown:
Generation I Dynamics: The paternal grandfather experienced chronic alcohol dependence and emotional volatility. The paternal grandmother coped through emotional distance, creating a distant marital bond. On the maternal side, sudden loss created unspoken grief that influenced parenting behaviors.
Generation II Dynamics: The index person's father adopted aggressive communication patterns learned in childhood, leading to high conflict in his marriage. The mother responded by forming an enmeshed bond with her eldest child to gain emotional stability, a textbook example of family triangulation.
Generation III Outcomes: The index person (Generation III) internalized family tension, manifesting high anxiety and depressive symptoms. By visualizing three generations together, the therapist helps the client realize that personal symptoms serve as a reflection of broader family system dynamics rather than individual failure alone. For additional trauma mapping techniques, read our guide on Mapping Intergenerational Trauma.
Case Study 2: The Hernandez Family (Medical Risk and Caregiver Burden)
Medical genograms focus heavily on genetic conditions, physical illnesses, and caregiver dynamics across generations. The Hernandez family example highlights how Type 2 Diabetes and cardiovascular risk persist across three generations alongside cultural caregiver expectations.
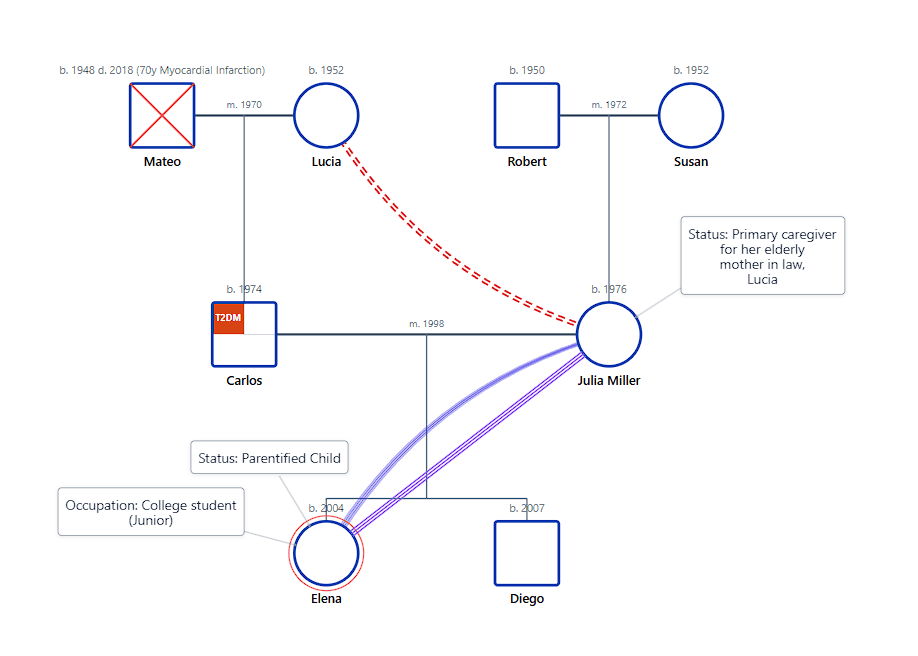
Figure 2: The Hernandez Family Genogram tracking 3 generations of medical health history and caregiver roles.
Medical and Health History Analysis:
Hereditary Health Tracking: Generation I shows early onset Type 2 Diabetes and hypertension in both grandparents. In Generation II, two out of three siblings developed metabolic syndrome before age 45. This visual warning allows healthcare providers to implement early preventive screenings for Generation III.
Caregiver Stress Patterns: The index person in Generation II functions as the primary caregiver for aging parents in Generation I while simultaneously raising adolescents in Generation III. This double caregiver role, often called the sandwich generation effect, is documented on the chart using caregiver relationship lines.
Case Study 3: The Thompson-Chen System (Triangulation and High-Conflict Divorce)
Visualizing the systemic triangulation of children in high-conflict divorces requires clear notation for legal custody and emotional distance. The Thompson-Chen example maps how parental conflict in Generation II pulls Generation III offspring into stabilizing roles.
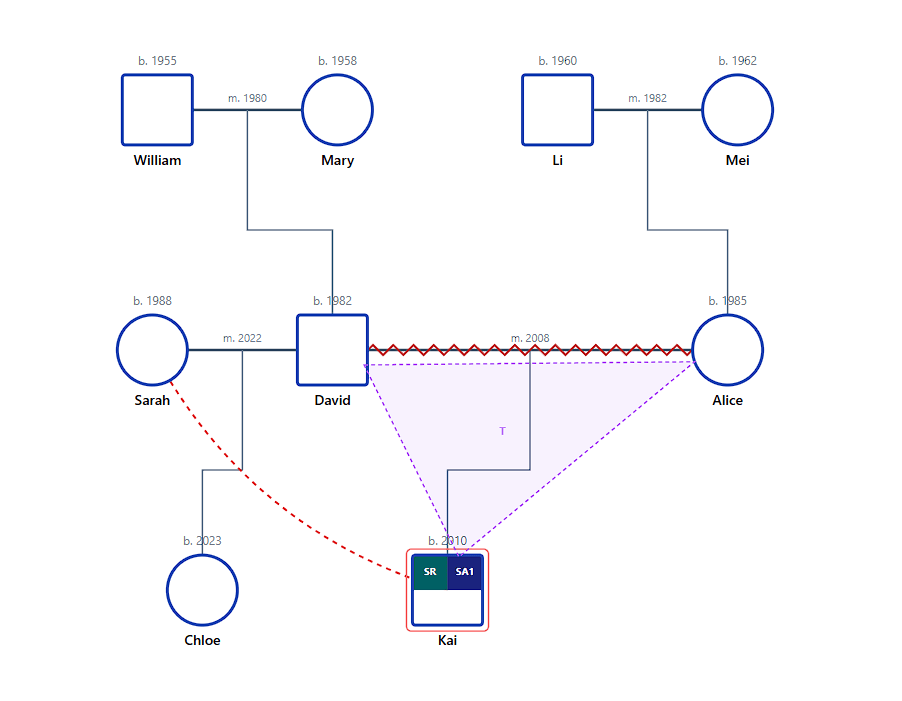
Figure 3: The Thompson-Chen Genogram displaying triangulation indicators (T) and hostile relationship lines.
Systemic Analysis:
The genogram uses two slashes on the marital connection line to indicate legal divorce between biological parents. High-conflict jagged lines link the former partners. A dashed triangle connects both parents to their child Kai, illustrating how Kai functions as a mediator during parental disputes.
Case Study 4: The O'Reilly Family (Addiction and Family Survival Roles)
Tracing intergenerational Alcohol Use Disorder (AUD) reveals how children adopt distinct survival roles (such as Hero, Scapegoat, or Lost Child) to maintain system stability in addicted family environments.
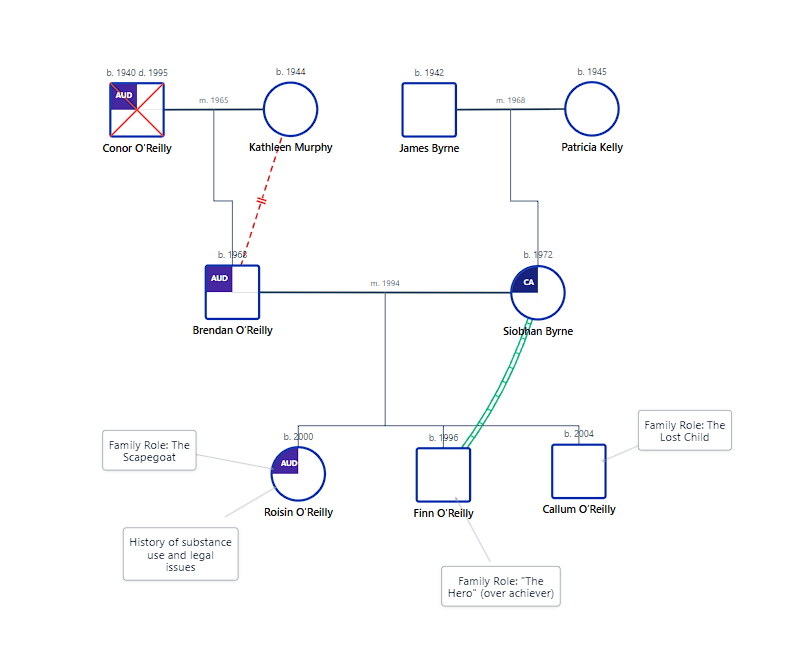
Figure 4: The O'Reilly Family Genogram tracking intergenerational alcohol dependence and survival role callouts across 3 generations.
Addiction Role Mapping:
In Generation I, the maternal grandfather exhibited severe alcoholism. In Generation II, two siblings developed substance dependence while one sister assumed a caretaker role. Annotation callouts in Generation III identify how the eldest child acts as the Family Hero, achieving high academic performance to distract from home tension.
Case Study 5: The Miller-Bennet Kinship Network (Substance Use Audit & Foster Placement)
Social workers evaluating child welfare cases use three generation kinship genograms to evaluate safe extended family placement options during active parental recovery.
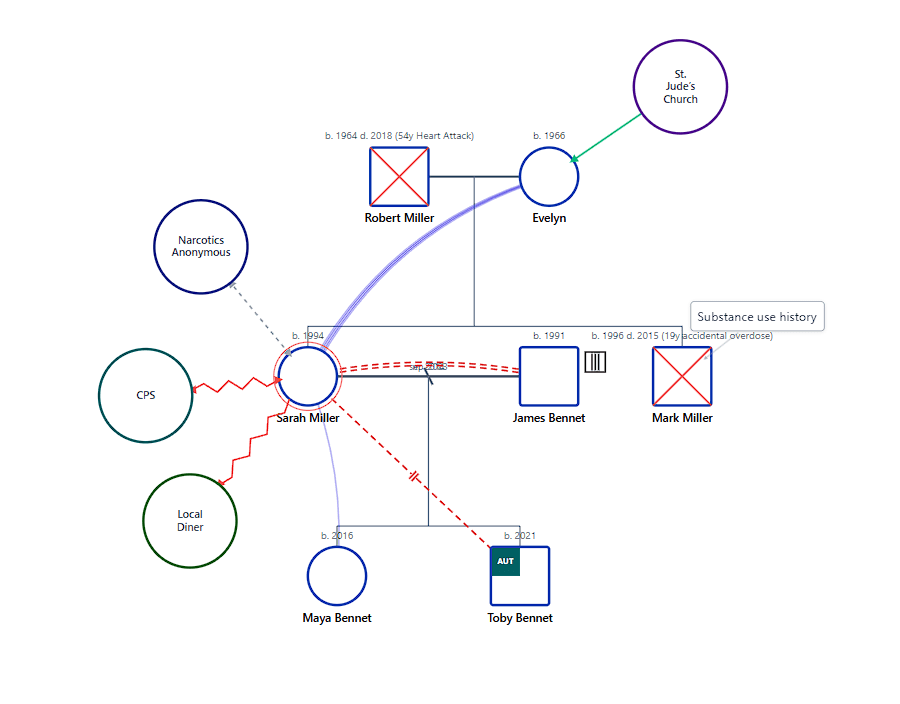
Figure 5: The Miller-Bennet Kinship Genogram identifying extended family support nodes for child welfare placement decisions.
Explore more case studies in the official Genogram Examples Gallery.
Pre-Built 3 Generation Templates from the Genosm Template Library
Starting from a blank workspace can feel overwhelming during brief clinical intake sessions. Clinicians and students can load pre-built starter structures from the Genosm Template Library to save time while maintaining formatting standards:
1. Standard 3 Generation Family Template
Pre-configured structure displaying maternal grandparents, paternal grandparents, two parents, and three children. Ideal baseline for initial individual or family therapy intakes.
Use Template →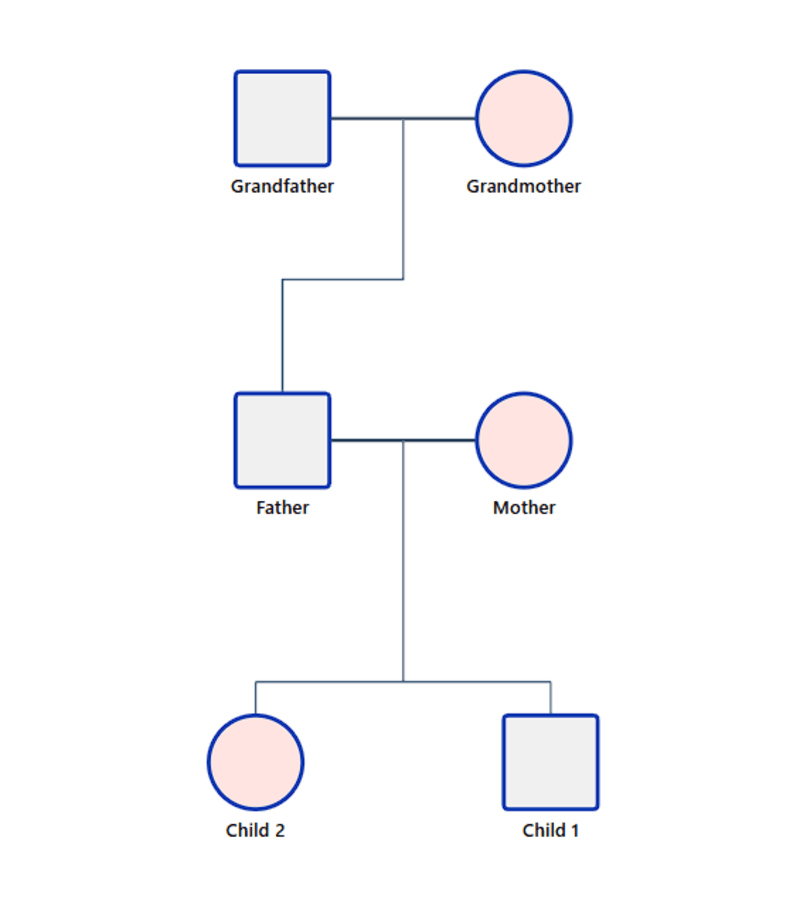
2. 4 Generation Extended Family Template
Expanded structure displaying great-grandparents down to great-grandchildren. Recommended for longitudinal medical genetics research and deep genealogical assessments.
Use Template →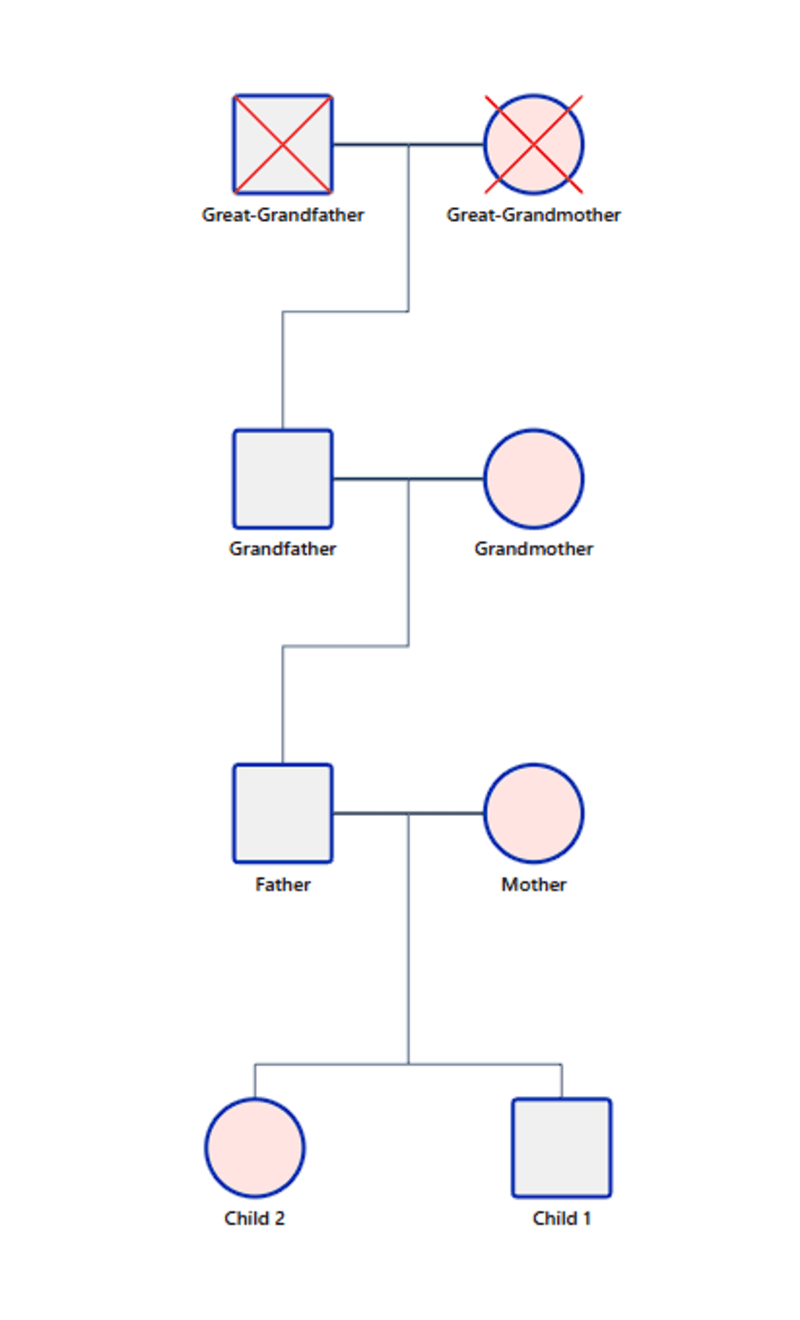
3. Extended Family Network Template
Complex interconnected family network spanning multiple households. Complete ecosystem for comprehensive family system analysis across aunts, uncles, and multiple sibling groups.
Use Template →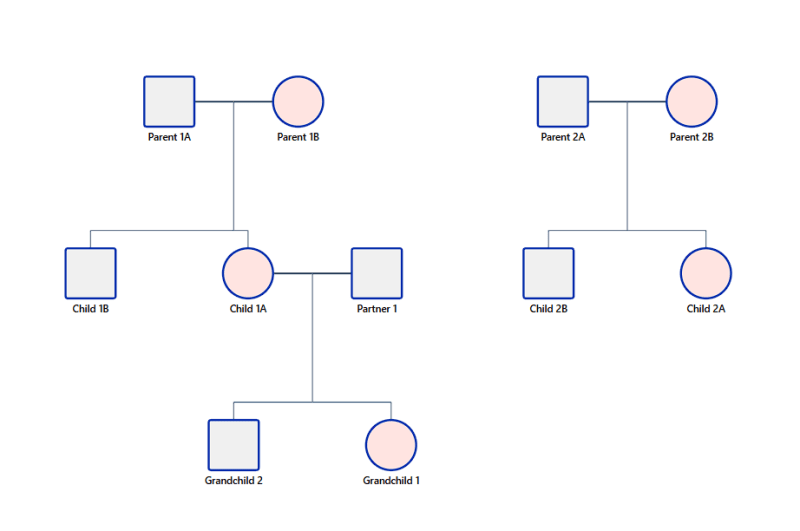
Access the complete collection of customizable starter layouts in the Genosm Template Directory or pair your genograms with social network maps using the Free Ecomap Maker.
Step-by-Step Instructions: How to Construct a 3 Generation Genogram
Creating an accurate three generation family diagram follows a logical four step sequence:
- Identify and Position the Index Person (Proband): Place the primary client in Generation III near the bottom center of your canvas. Draw a square for a male, a circle for a female, or a diamond for non-binary individuals. Use a double outline to mark them as the focal point of assessment.
- Map Generation II (Parents and Siblings): Draw horizontal lines above the index person connecting their biological mother and father. Arrange siblings from left to right in chronological order of age, with the oldest sibling placed on the far left.
- Add Generation I (Grandparents): Extend vertical lines upward from each parent to introduce both sets of grandparents. Document birth years, death years, physical health conditions, and historical occupation notes.
- Overlay Relationship and Emotional Lines: Draw emotional relationship lines between individuals. Add notes for physical health conditions, addiction history, or legal separations. Review symbol rules in our Genogram for Therapists Guide.
Common Mistakes to Avoid in 3 Generation Diagrams
When drafting three generation charts, clinicians should watch for five frequent formatting errors:
- Incorrect Sibling Age Ordering: Placing younger siblings on the left disrupts standard reading conventions. Always position the oldest sibling on the far left.
- Confusing Adoption Lines: Using solid lines for adoptive parenting can mislead medical geneticists. Always use dashed lines for adoptive bonds and solid lines for biological origins.
- Omitting Unmarried Partners: Failing to document significant long term cohabitating partners distorts the child's true emotional system.
- Misplacing Divorce Markers: Placing divorce slashes on the parent-child line rather than the marital connection line creates visual confusion.
- Ignoring Extended Household Boundaries: Failing to draw a dashed boundary line around individuals sharing a physical residence hides current caregiver support networks.
Frequently Asked Questions
Why is a 3 generation genogram the clinical standard?
Three generations reveal long term recurring behavioral patterns, psychological transmission, and health conditions across grandparents, parents, and children that two generation diagrams miss.
What three generations should be included?
The diagram typically includes the index person (client), their siblings and children, their parents and aunts/uncles, and both maternal and paternal grandparents.
How do you show adoption in a 3 generation chart?
Use solid lines to indicate biological lineage and dashed vertical lines with an 'A' symbol to indicate adoptive parenting connections.
Build Your 3 Generation Genogram in Minutes
Genosm stores data 100% locally in your browser to maintain client privacy and HIPAA alignment. No mandatory software downloads required.