Clinical Origins: Dr. Jacob L. Moreno and the Science of Sociometry
Sociometry was founded in the 1930s by psychiatrist and psychodrama pioneer Dr. Jacob L. Moreno (1934) in his seminal text Who Shall Survive? Foundations of Sociometry, Group Psychotherapy, and Sociodrama. Moreno discovered that beneath the formal, visible structure of any human group (such as a therapy cohort, school classroom, hospital unit, or workplace team) lies an invisible, psychological network of interpersonal attractions, indifferences, and repulsions.
A Sociogram is the graphical mapping of these underlying socio-emotional ties. By administering specific criteria questions (for example, "Who would you prefer to work with on a challenging task?" or "Who do you turn to for emotional support when distressed?"), practitioners uncover social hierarchies, cliques, communication bridges, and isolated individuals who are vulnerable to emotional distress or dropout.
In subsequent decades, sociometry was formalized into empirical mathematical models by researchers such as Coie, Dodge, & Coppotelli (1982) and Newcomb, Bukowski, & Pattee (1993). By applying standardized Z-scores to positive choices and negative rejections, modern sociometry eliminates subjective clinician bias and provides a rigorous, repeatable diagnostic instrument.
The 6 Sociometric Status Roles (Z-Score Standardized)
Genosm automatically normalizes incoming positive choices (Choice Status, CS) and incoming rejections (Rejection Status, RS) against the group's statistical mean and standard deviation. Each member is classified into one of six evidence-based sociometric roles:
1. Sociometric Star (Popular)
Ring 1 • CenterStatistical Criterion: High Choice Status (Z_CS ≥ 1.0), Low Rejection (Z_RS ≤ 0.5).
The central positive hubs of the group. Stars possess high social capital, emotional intelligence, and trust. In group therapy, they serve as natural co-facilitators and culture carriers.
2. Average / Accepted
Ring 2 • Inner-MiddleStatistical Criterion: Standard choices and rejections near the group mean (-1.0 < Z < 1.0).
Represents the stable core of the group. Average members have a balanced mix of mutual friendships and moderate visibility without extreme polarization.
3. Controversial / Polarized
Ring 3 • Middle-OuterStatistical Criterion: High Choice Status (Z_CS ≥ 0.5) AND High Rejections (Z_RS ≥ 0.5).
Highly active and influential individuals who elicit strong emotional reactions. Strongly liked by one subgroup or clique while actively disliked or rejected by another.
4. Neglected / Quiet
Ring 3 • Middle-OuterStatistical Criterion: Very low Social Impact (Z_SI ≤ -1.0), low choices and low rejections.
Individuals who are 'invisible' to the group. They rarely participate, emit few choices, and are seldom mentioned by peers. Highly responsive to gentle clinical facilitation.
5. Rejectee (Rejected)
Ring 4 • PeripheryStatistical Criterion: High Rejection (Z_RS ≥ 1.0), Low Choice Status (Z_CS < 0.0).
Actively disliked or rebuffed by multiple group members. High clinical risk for hostility, defensiveness, premature group termination, or bullying victimization.
6. Isolate (Disconnected)
Ring 4 • PeripheryStatistical Criterion: Zero incoming choices (In-Degree = 0) and zero outgoing choices (Out-Degree = 0).
Complete detachment from the social network. Total absence of relational ties indicates acute alienation, extreme avoidance, or profound group disengagement.
Group Cohesion, Integration & Expansion Indices
Genosm provides real-time mathematical scorecards evaluating overall group health and relational maturity:
Measures mutual bonding density (0.0 to 1.0). High CI indicates strong mutual trust and group solidarity.
Measures overall inclusion (0.0 to 1.0). A score of 1.0 indicates that every single member possesses at least one relational connection.
Measures outbound social energy and the average volume of positive nominations emitted per participant.
3 Layout Engines: Moreno Target, Circular & Force Graph
Different clinical and analytical situations require different visual perspectives. Genosm allows clinicians to toggle seamlessly between three layout engines:
1. Moreno Concentric Target View (Default)
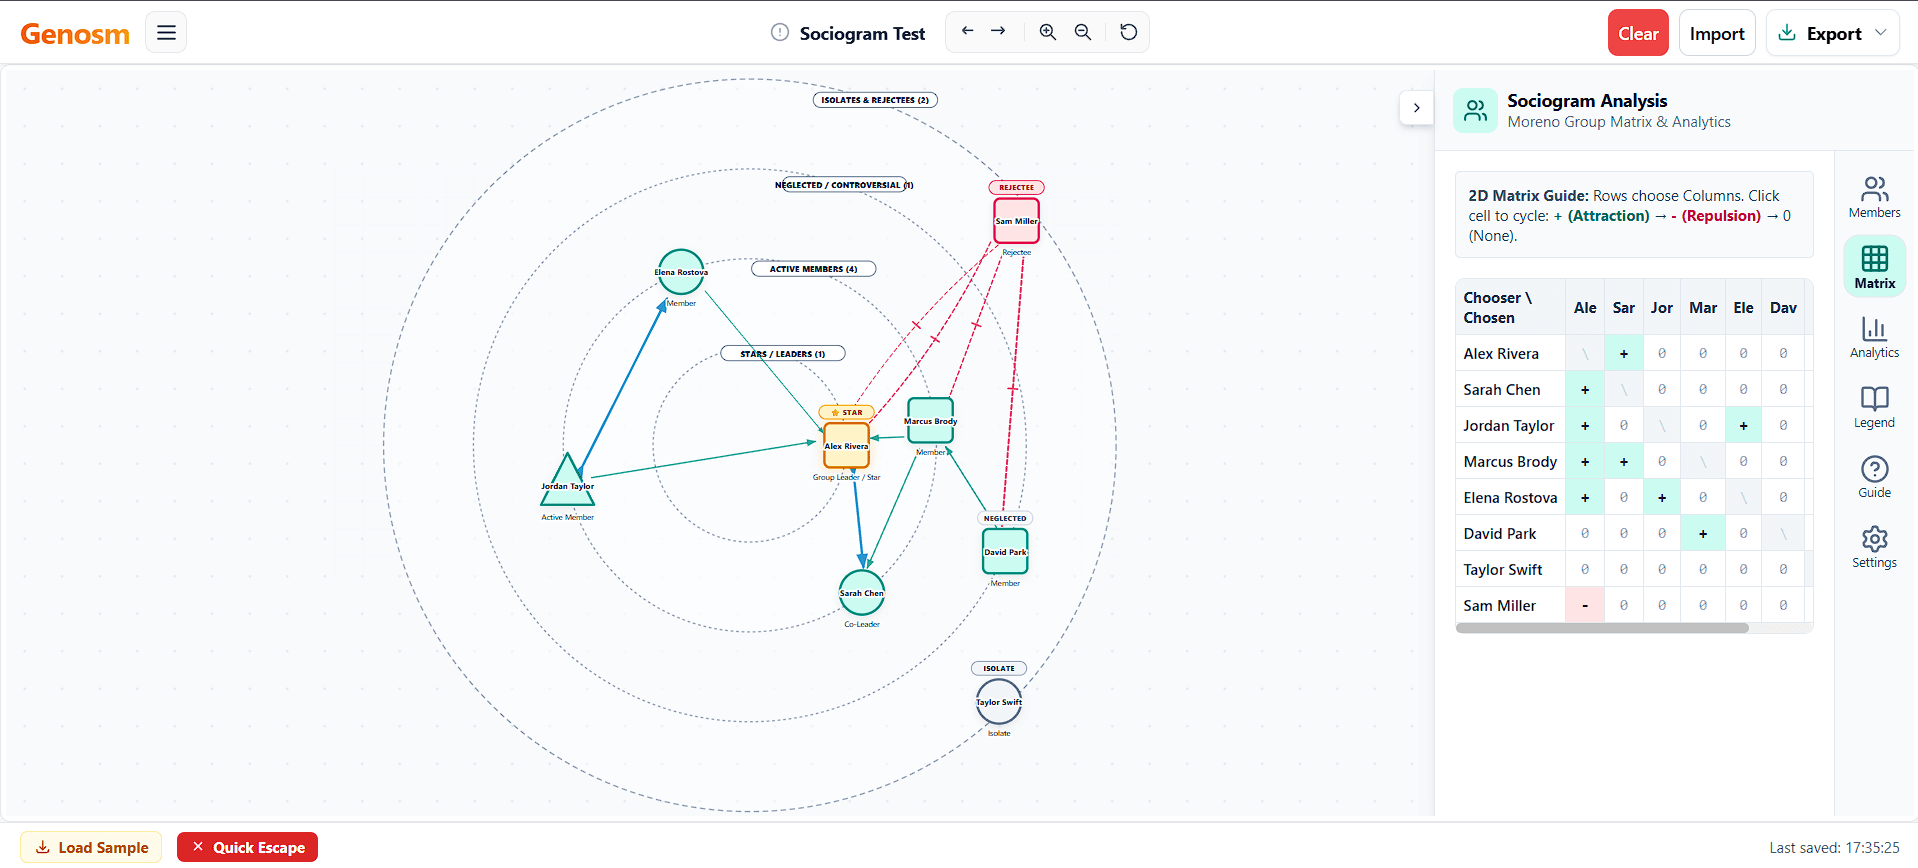
Standard SociometryOrganizes the group into four concentric circular tiers based on status: Stars in the center ring, Average in the inner-middle ring, Controversial/Neglected in the middle-outer ring, and Rejectees/Isolates on the outer periphery. Utilizes dynamic expanding radii to guarantee zero node overlap regardless of group size.
2. Circular Perimeter Arrangement
Equalized DiscussionPlaces all group members at equal distances along a single large circle, drawing vector arrows across the center. Ideal for psychoeducational group discussions where maintaining a non-hierarchical visual format is clinically preferred.
3. Physics Force-Directed Network Graph
Clique DetectionExecutes a dynamic force simulation where mutual attractions pull members together into tight relational clusters (cliques) while repulsions push conflicting members apart. Instantly exposes subgroup fracturing and communication bridge nodes.
Interactive 2D Sociometric Matrix Grid Editor
Entering relational data across a 20-person group by drawing individual arrows is slow and error-prone. Genosm provides a dedicated 2D Sociometric Matrix Editor:
1-Click Matrix Cell Toggling
Rows represent Choosers; columns represent Chosen. Click any intersection cell to cycle rapidly through Neutral (0), Attraction (+), and Repulsion (-).
Weighted Relational Intensity
Supports 3-tier weighting (Weight 1 = Weak / Secondary Choice, Weight 2 = Standard, Weight 3 = Primary Strong Preference).
Reciprocal Mutual Pair Merging
When two members mutually choose each other, Genosm merges the directional lines into a single double-headed solid connector to reduce visual clutter.
Ego-Centric Tracing
Select any individual to instantly dim all unrelated group ties and isolate that participant's exact incoming and outgoing relational web.
How to Construct a Sociogram in Genosm
Follow this five-step clinical procedure to administer, map, and analyze group sociometrics:
Define Group & Sociometric Criteria
Name the group (e.g. Adolescent DBT Skills Group) and establish the specific criteria prompt (e.g. "Who do you trust most with personal emotions?").
Add Members & Subgroup Tags
Enter participant names, gender roles (Female, Male, Non-Binary), and department or table subgroup identifiers.
Populate the 2D Choice Matrix
Input nomination ballots into the matrix grid, instantly generating attraction arrows and repulsion dashed lines on the canvas.
Analyze Group Cohesion & Isolates
Inspect calculated Z-score roles on the Moreno target rings and review Group Cohesion (CI) and Integration (II) scorecards.
Present Anonymously & Export Vector Records
Toggle Anonymity Mode for group psychoeducation and export 300 DPI vector PDFs, SVGs, or JSON backup files.
Therapy, School & Organizational Workflows
Sociometry is utilized across diverse clinical and educational environments:
Group Psychotherapy
Track trust, alliance formation, scapegoating, and subgroup fracturing in DBT, substance recovery, and interpersonal process therapy groups.
School Psychology
Identify classroom peer rejection, bullying patterns, and quiet isolates requiring social skills intervention or seat rearrangement.
Organizational Teams
Map informal communication channels, key knowledge silos, and collaboration bottlenecks within corporate departments.
Pairing Sociograms with Other Genosm Diagrams
Genosm provides an integrated suite of 14 clinical diagramming tools. Clinicians frequently pair the Sociogram with these related formulation tools:
Johari Window & Interpersonal Disclosure Matrix
Interpersonal FeedbackUse the Johari Window to help sociometric Isolates and Controversial members explore their Open, Blind, and Hidden quadrants, expanding self-awareness within group dynamics.
Analyze recurring interpersonal conflicts and crossed transactions between polarized members on the Sociogram using Parent-Adult-Child ego states and Karpman Drama Triangle roles.
Polyvagal Ladder & Social Engagement System
Autonomic StateConnect sociometric peer rejection to dorsal vagal shutdown in rejected members, or map how sociometric Stars act as ventral vagal co-regulation anchors for the entire cohort.
100% Local-First Data Privacy and Anonymity Mode
Group peer evaluations and rejection nominations represent highly sensitive personal data. Generic cloud whiteboards store participant names on shared remote databases, creating major ethical and privacy risks.
Genosm uses a zero-storage, local-first architecture. When building a Sociogram:
- All Z-score statistics, matrix calculations, and target rings compute locally in your browser.
- Participant names and attraction/repulsion choices are never sent to remote Genosm servers.
- Files save directly to your local device or encrypted browser database (IndexedDB).
- Includes an instant Anonymity Mode that converts names into codes (F1, M2, NB3) for group presentations.
Why Genosm Outperforms Generic Software
| Feature | Genosm | Generic Whiteboards (Miro/Lucid) | Paper Nomination Sheets |
|---|---|---|---|
| Moreno Target Rings | Automated Z-score concentric ring layout | Manual disjointed circles | Hand drawn concentric rings |
| 2D Choice Matrix Grid | 1-click interactive cell toggle editor | None (manual text boxes) | Manual paper tally sheet |
| Group Cohesion Analytics | Auto-calculated CI, II, and EI metrics | None | Requires manual hand math |
| Anonymity Presentation Mode | 1-click gender/index code masking | None | Requires manual re-drawing |
| Vector PDF & SVG Exports | 300 DPI vector PDF and SVG graphics | Rasterized screenshot | Physical paper folder |
| Patient Data Privacy (HIPAA) | 100% Local-First (Zero Server PHI) | Third-party cloud risk | Physical storage risk |
Sociogram Chart Maker FAQ
What is a Sociogram and who developed Sociometry?
A Sociogram is a visual graph representing interpersonal social relationships, preferences, attractions, and repulsions within a group. Developed by psychiatrist Dr. Jacob L. Moreno in 1934 in his landmark work "Who Shall Survive?", sociometry provides a scientific methodology to measure and map the structure of human group dynamics.
What are the 6 Sociometric Status Roles in Genosm?
Based on standardized Z-score algorithms (Coie, Dodge, & Coppotelli, 1982), Genosm classifies group members into 6 distinct status roles: 1. Sociometric Star (high positive choices, low rejections, placed in center ring), 2. Average (moderate positive and negative choices near the group norm), 3. Controversial / Polarized (high positive and high negative choices), 4. Neglected (very low social impact, rarely chosen or rejected), 5. Rejectee (high negative rejections, low positive choices), and 6. Isolate (zero incoming or outgoing connections, placed on outer periphery).
What mathematical indices does Genosm calculate for groups?
Genosm automatically computes key sociometric metrics: Group Cohesion Index (CI, the proportion of mutual positive dyads relative to maximum possible pairs), Integration Index (II, the proportion of non-isolated members), Expansion Index (EI, average positive choices emitted per member), Choice Status (CS), Rejection Status (RS), Social Preference (SP), and Social Impact (SI).
How does the Concentric Target layout prevent node overlaps?
Genosm utilizes a dynamic expanding ring radius engine. Rather than using fixed static circles, the algorithm calculates the circumference required to guarantee strict edge-to-edge separation for all members assigned to each concentric tier, applying alternating angular phase shifts to eliminate line crossings.
What is Anonymity Mode in Genosm Sociogram?
Anonymity Mode masks real participant names with standardized alphanumeric research codes (such as F1, M2, NB3) with a single click. This allows clinicians, school psychologists, and team facilitators to project or present sociograms during group sessions without compromising individual confidentiality.
Is client relational data stored on remote servers?
No. Genosm operates on a 100% local-first, zero-storage architecture. All sociometric matrix calculations, participant names, and network layouts execute locally in your browser. No Protected Health Information (PHI) is ever transmitted to or stored on remote cloud databases.